
Andorra Open Valley measured its Demo Day audience response with Emogg
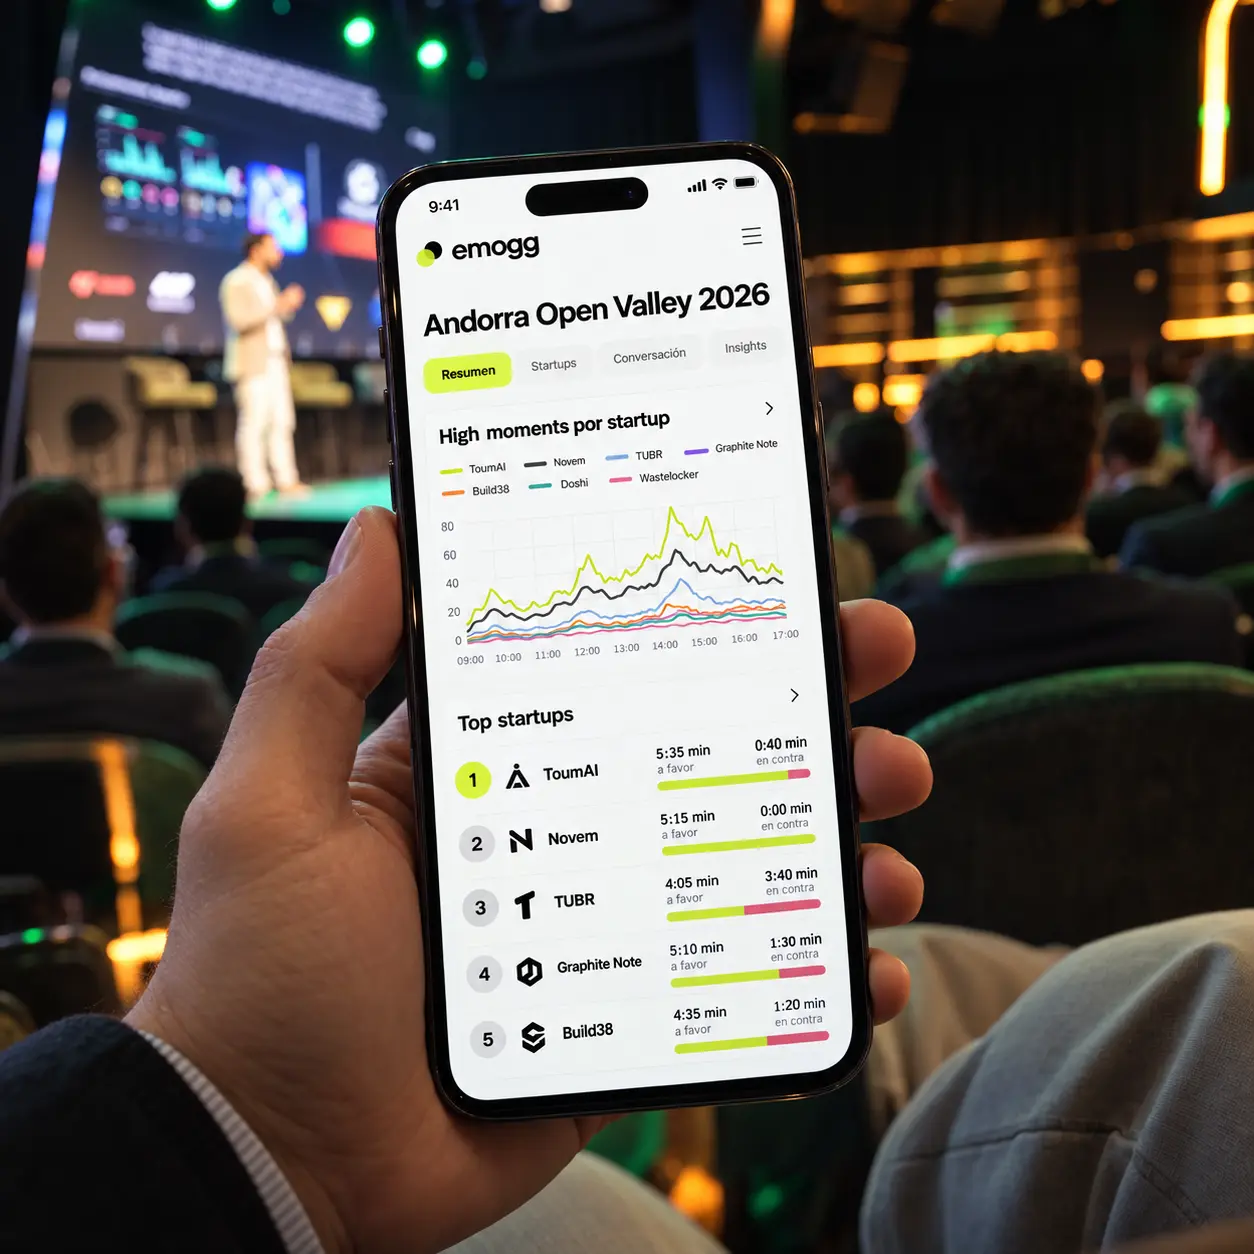
The Andorra Open Valley Demo Day was measured with Emogg Analytics, turning audience response across seven pitches into useful information for future editions.
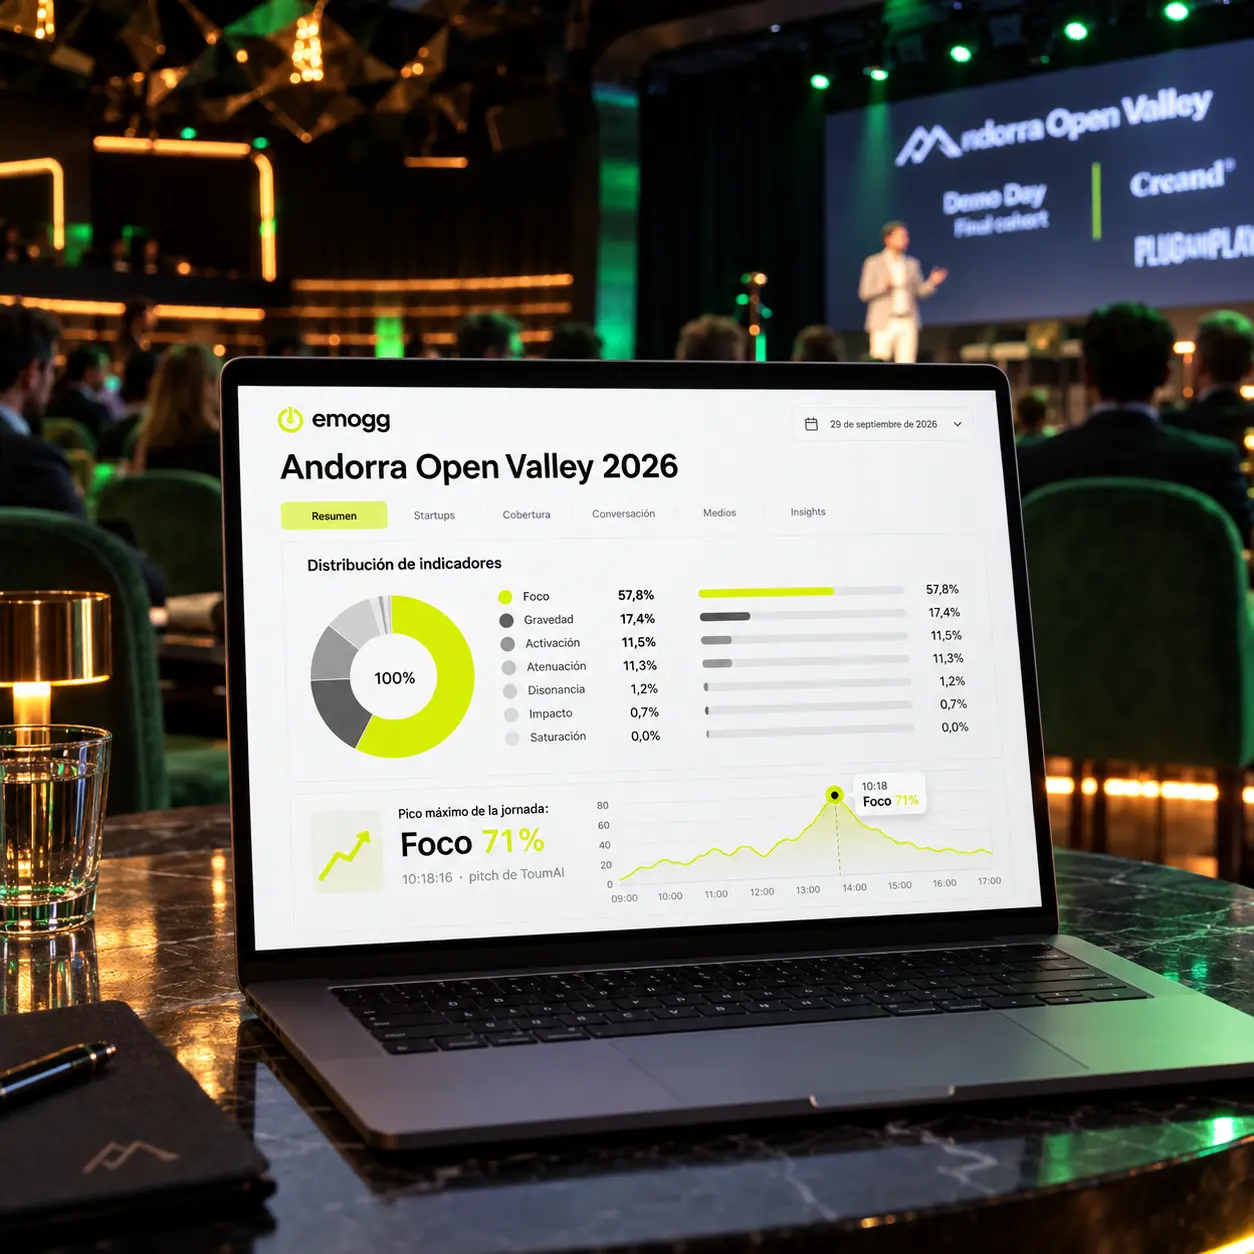
On 29 September, Andorra Open Valley held the Demo Day for the first cohort of its acceleration programme at Espacio Unnic. Emogg Analytics was there with two roles: measuring audience response throughout the event and sharing a real case showing how an acceleration programme can lead to a business relationship.
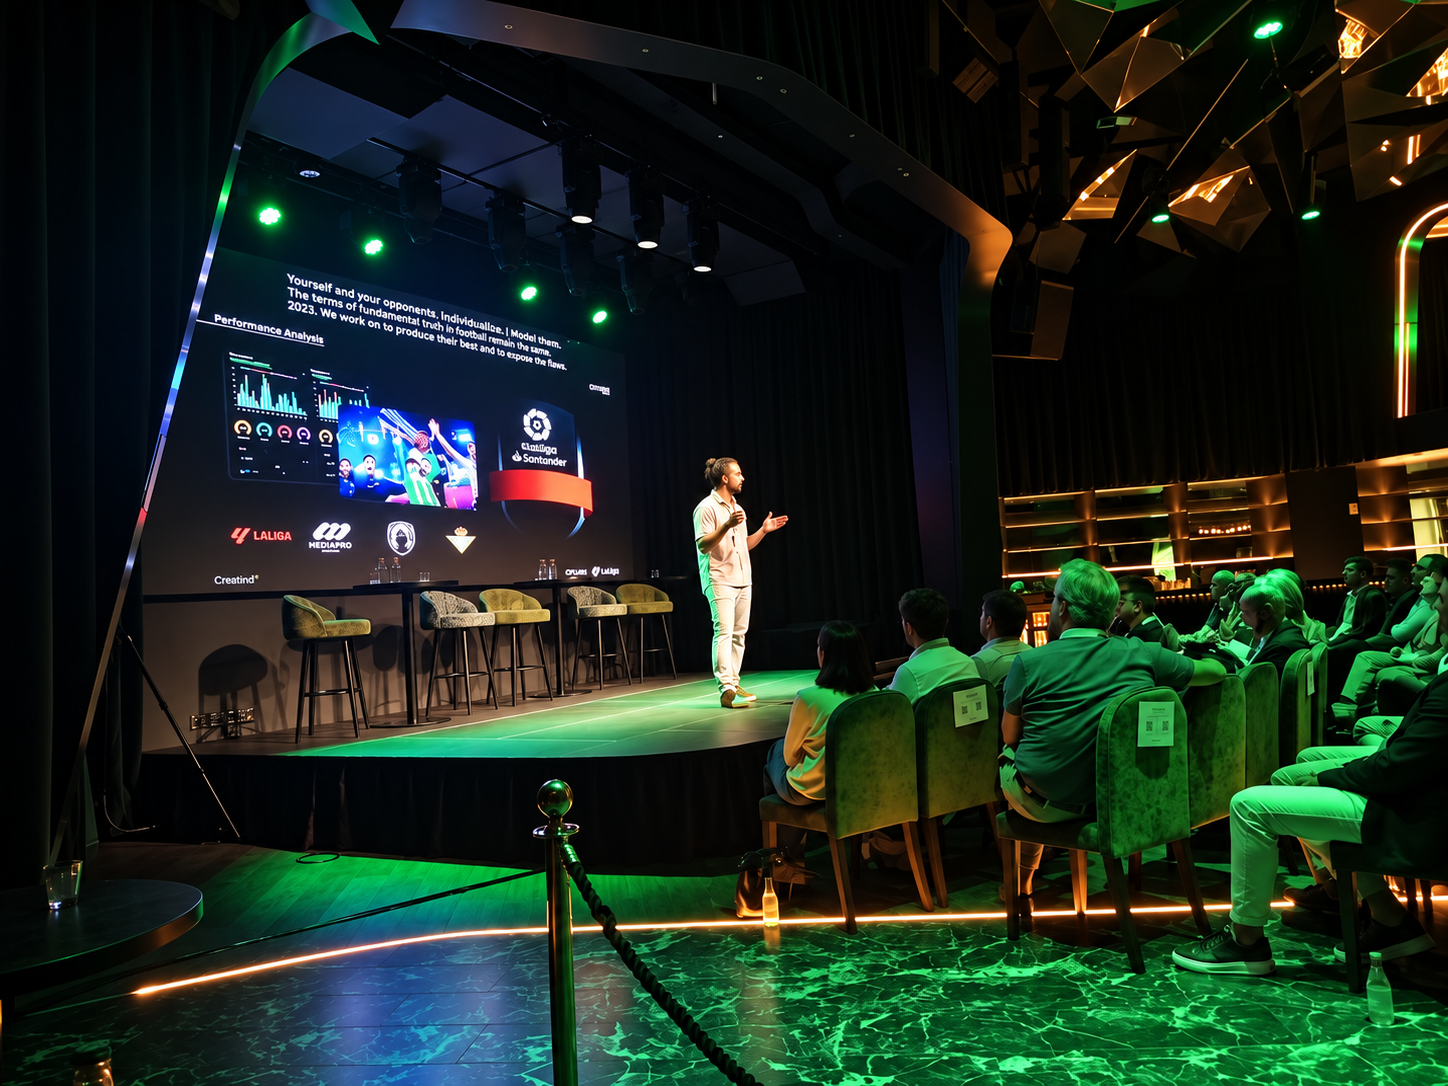
Ninety-three minutes of pitches, read block by block
The report delivered to Creand covers 1 hour and 33 minutes and the presentations of seven startups. The reading was matched to the running order to understand what happened in each block, rather than relying only on the event-wide average.
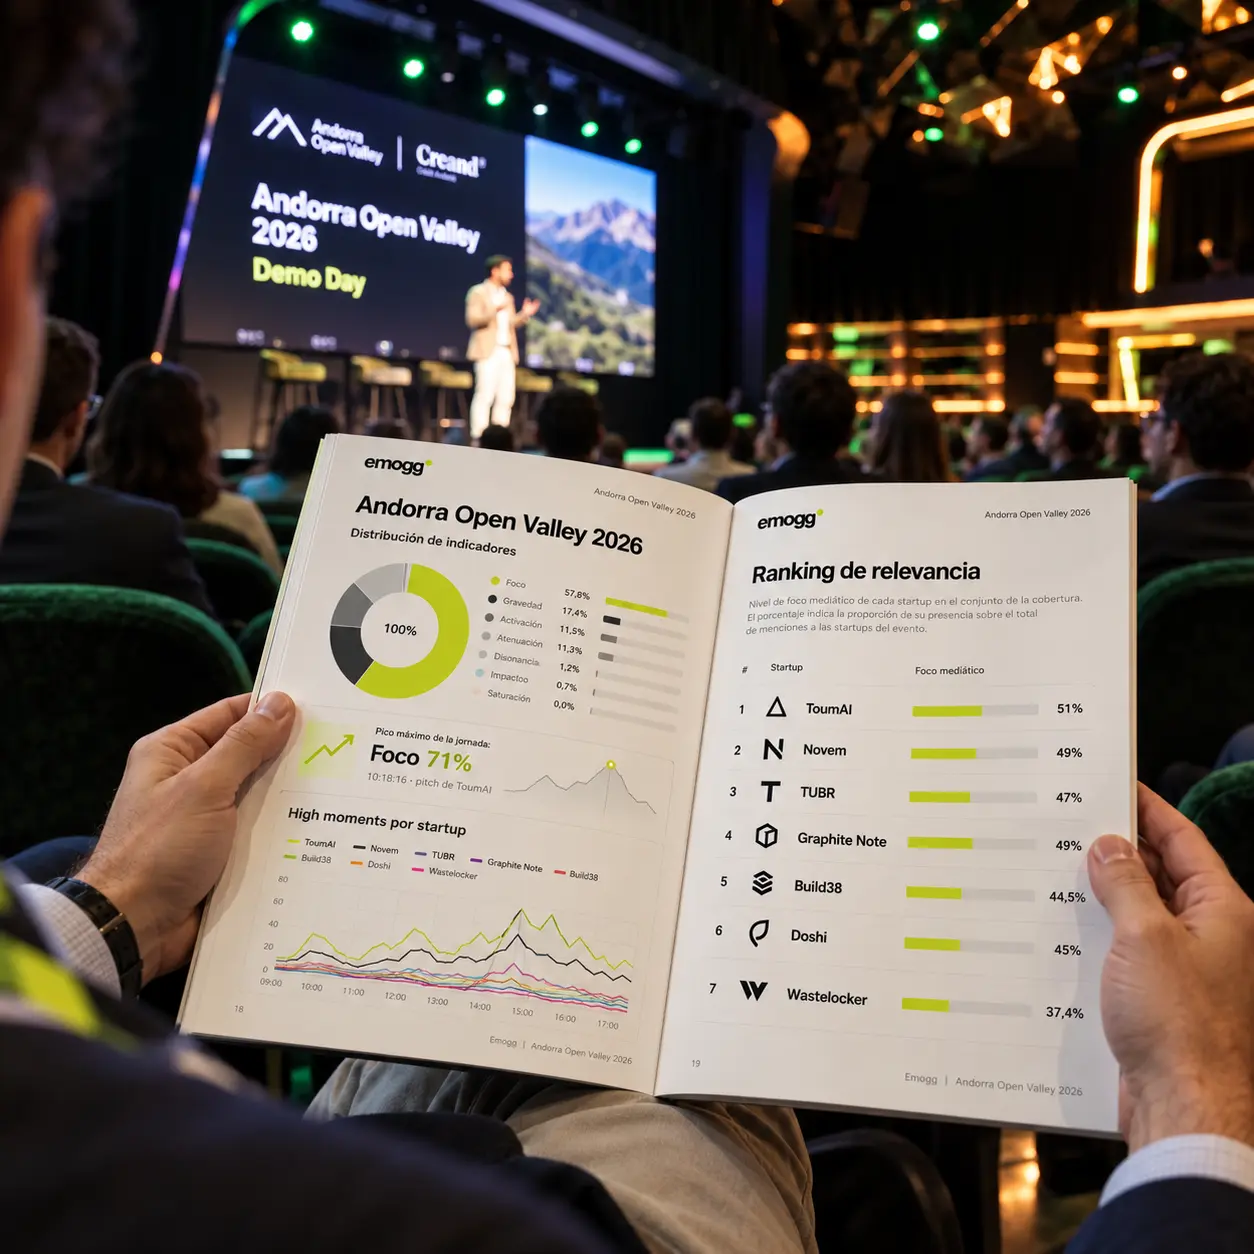
Focus was the dominant indicator, accounting for 57.8% of the normalised indicator distribution. The highest Focus peak reached 71% at 10:18, during ToumAI's pitch. These figures are relative to this event: they allow moments and content to be compared within the session, rather than acting as an external benchmark.
The reading was aggregated and anonymous. No images were stored and attendees were not identified.
What an organiser can decide from this reading
An average tells only part of the story. By matching the indicators to the running order, the organising team can see:
- which content holds attention most effectively;
- when audience response rises or falls;
- which speaking order works best;
- where an example, visual change or clearer ending may help;
- which learnings to carry into the next edition.
The report does more than rank results. It includes a reading for each startup and practical recommendations for refining the next pitch. Post-event evaluation therefore becomes a working tool for content, production and event leadership, rather than relying solely on impressions.
From Madrid in Game to MWC 2026
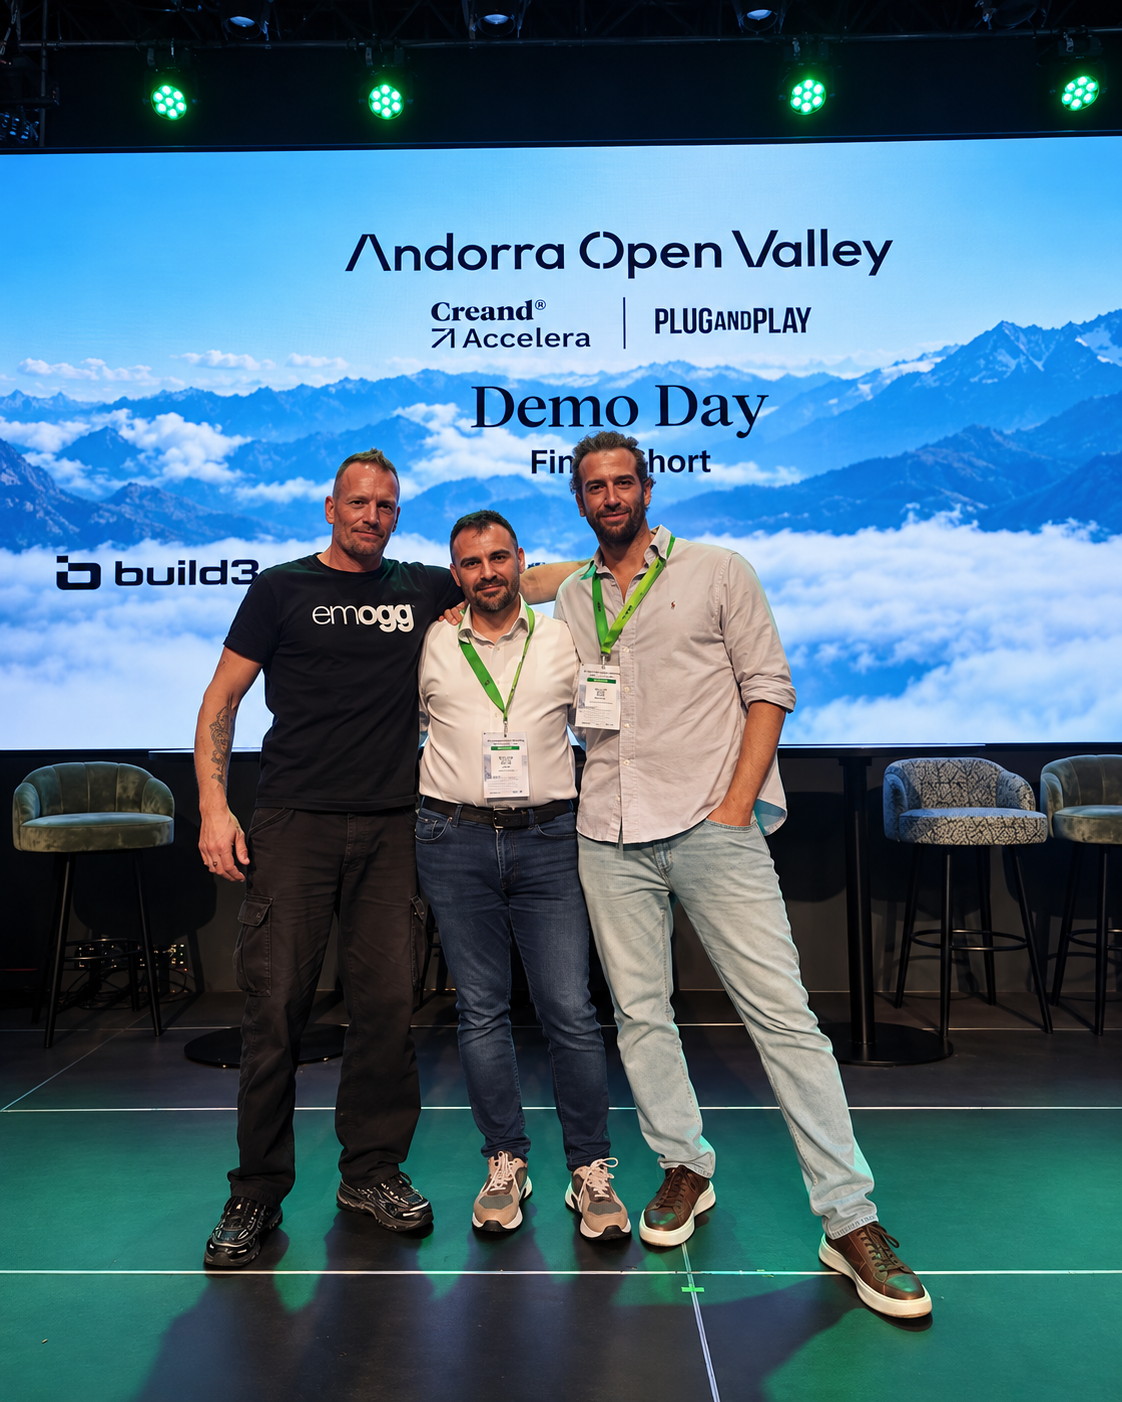
During the event, Emogg Analytics founder Edgar Sanjuán presented the success story that grew out of the Madrid in Game acceleration programme. Together with Experientia, a programme partner, Emogg analysed the Telefónica stand at MWC 2026.
The case illustrated a straightforward idea: the value of an accelerator does not end when the programme finishes. It emerges when startups and partners connect and turn a pilot into a real application for a client.
From the event to the report, and from the report to a decision
The results were available through the Emogg dashboard and were also delivered in a report designed to be shared. The same content can be viewed across devices, giving production, content and leadership teams a common reading.
For an organiser, measurement is not about collecting charts. It is about knowing what to keep, what to change and how to prepare the next edition more effectively.