
Content
Talks, videos, training, product presentations. Which parts hold attention and which ones lose it.
The product
Emogg Analytics reads the response of a significant sample of the audience as it happens and turns it into objective data: what holds attention, which moments work and what to change next time.
What is evaluated
Talks, videos, training, product presentations. Which parts hold attention and which ones lose it.

Booths, rooms, routes and zones within a venue. Where impact happens and where nothing does.
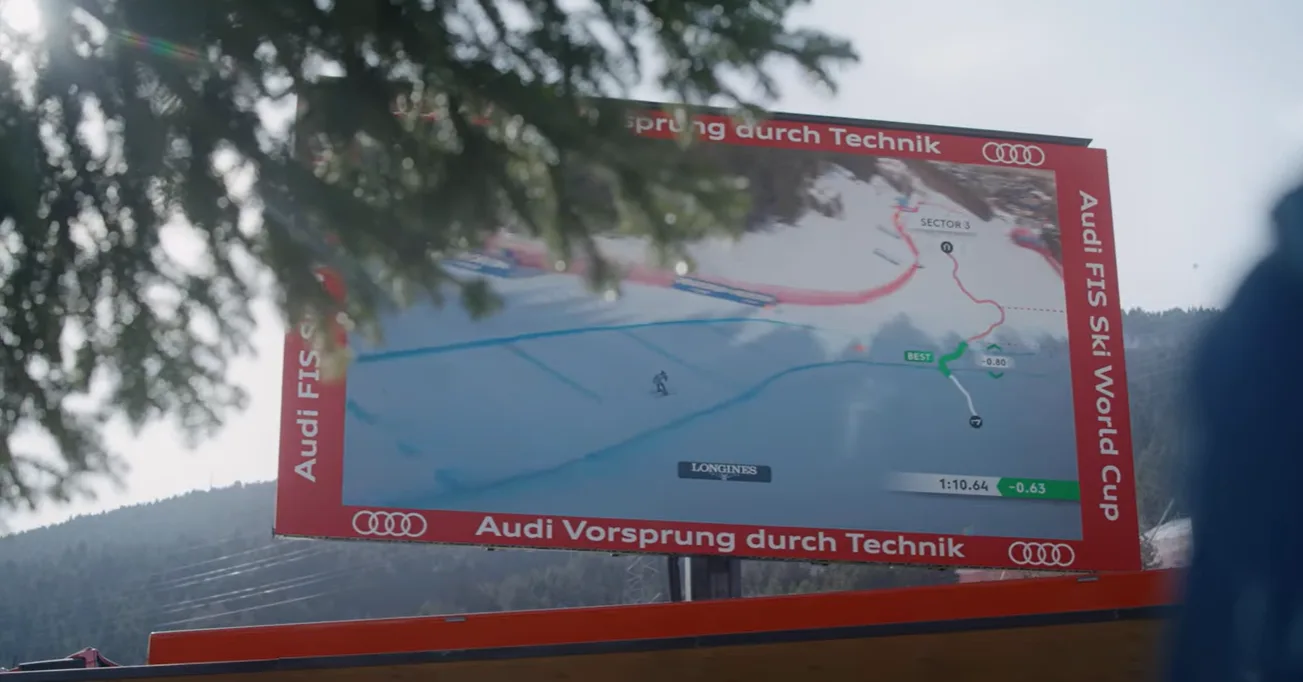
Events, activations and full visits. How the audience as a whole behaves from start to finish.
How it works
Fast, non-intrusive, GDPR-compliant setup, configured for the capacity and layout of the room or space.
Body and gesture patterns of groups, processed in real time and always in aggregate.
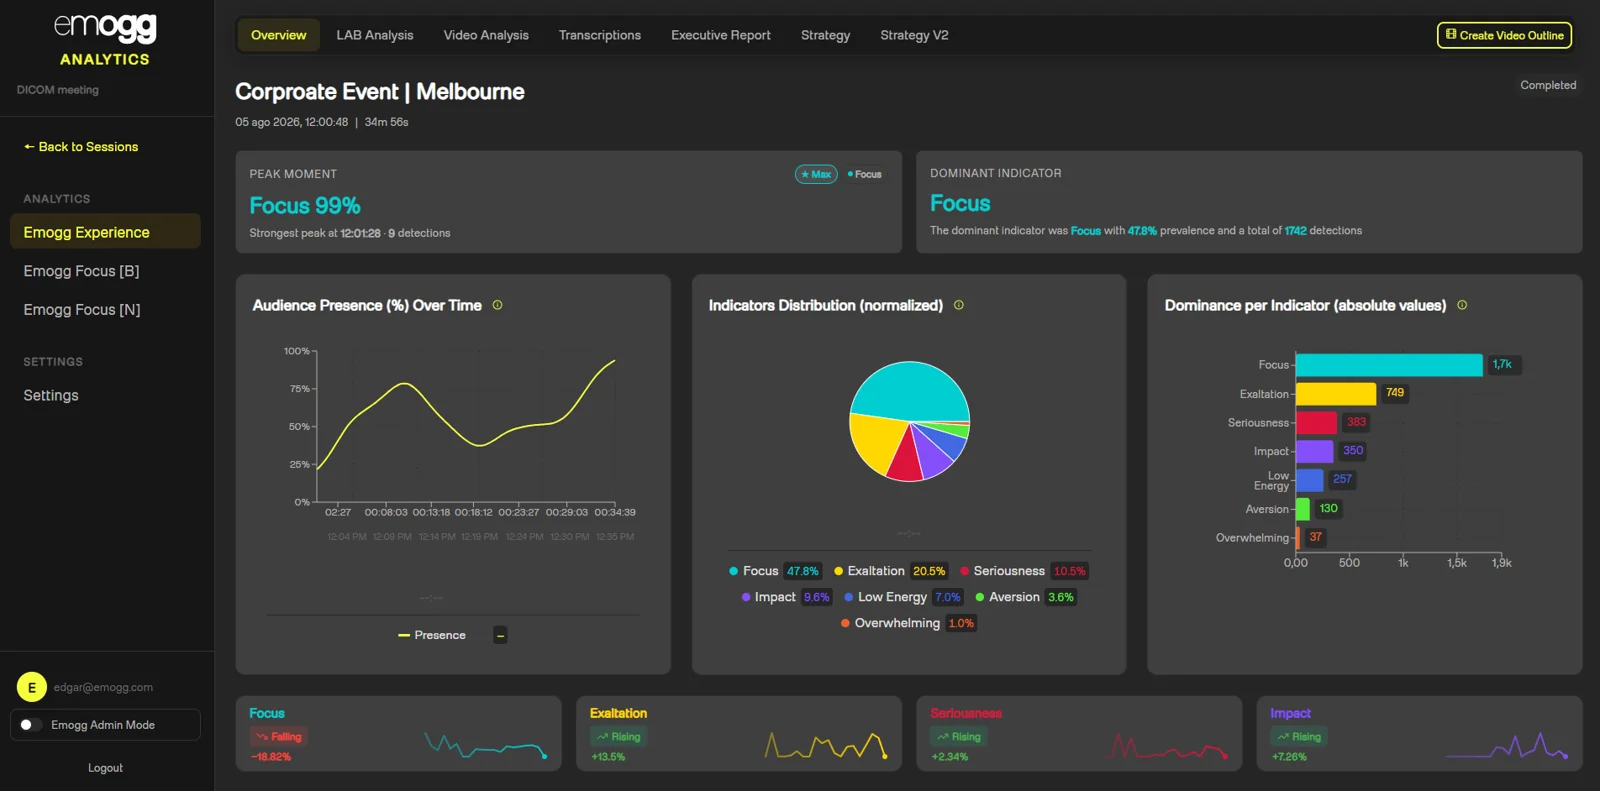
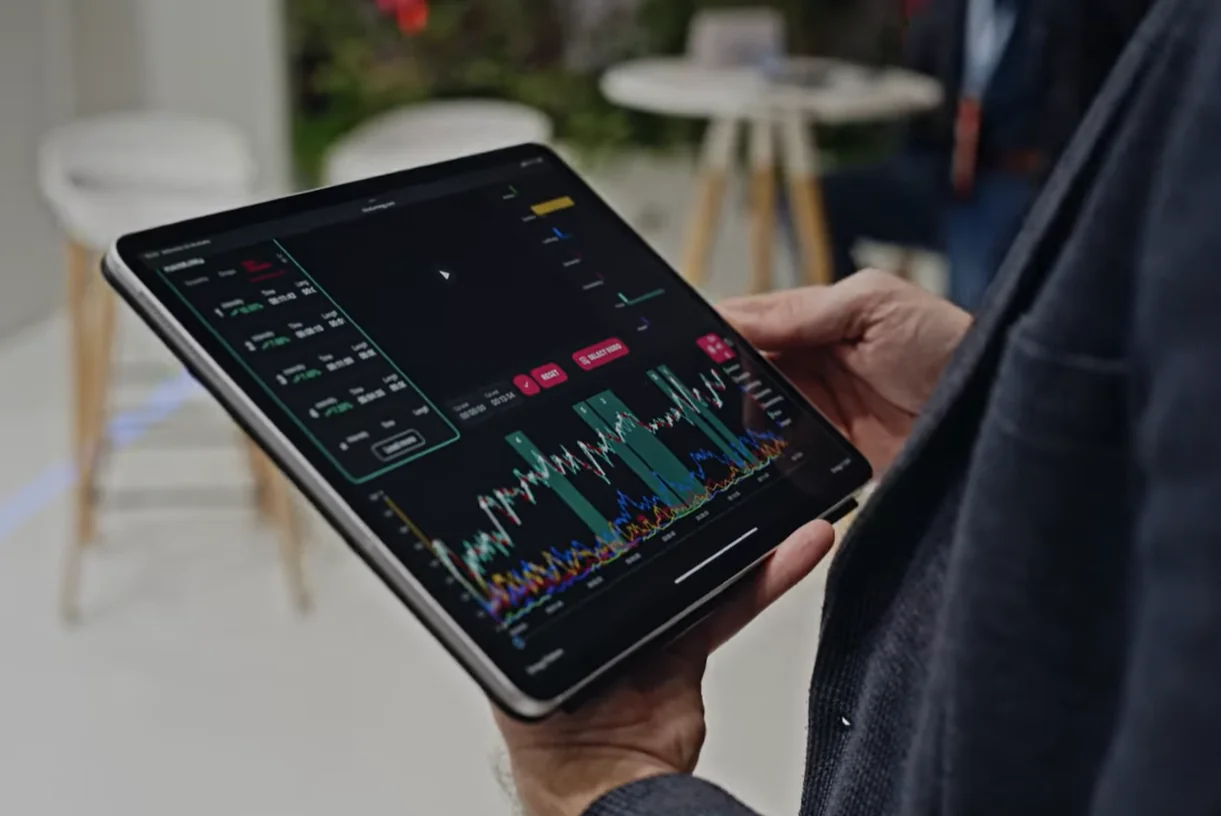
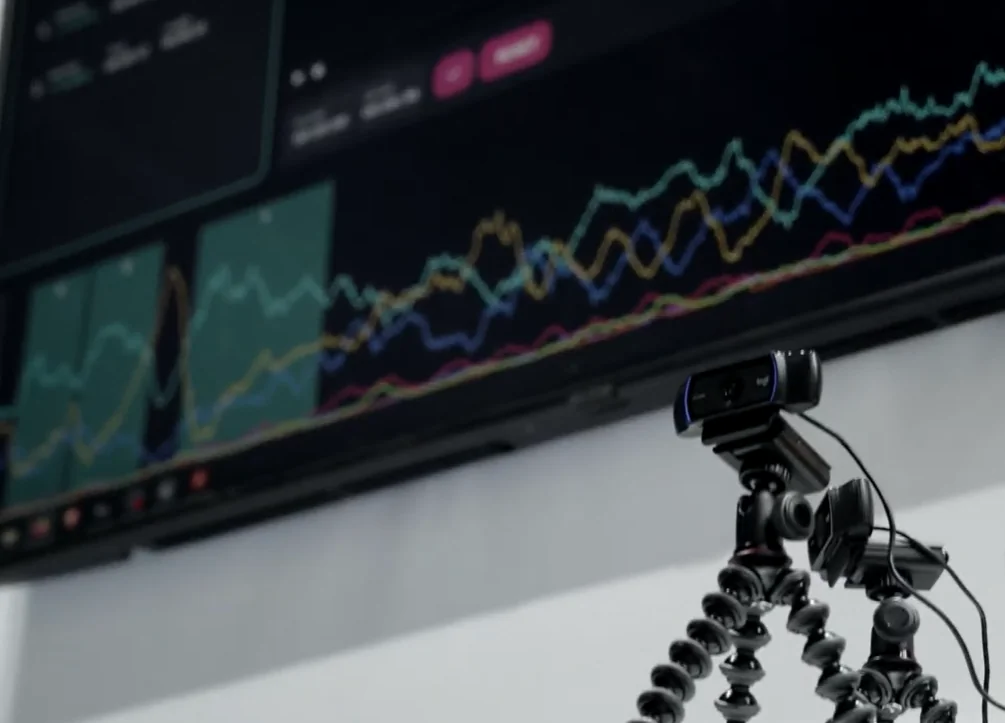
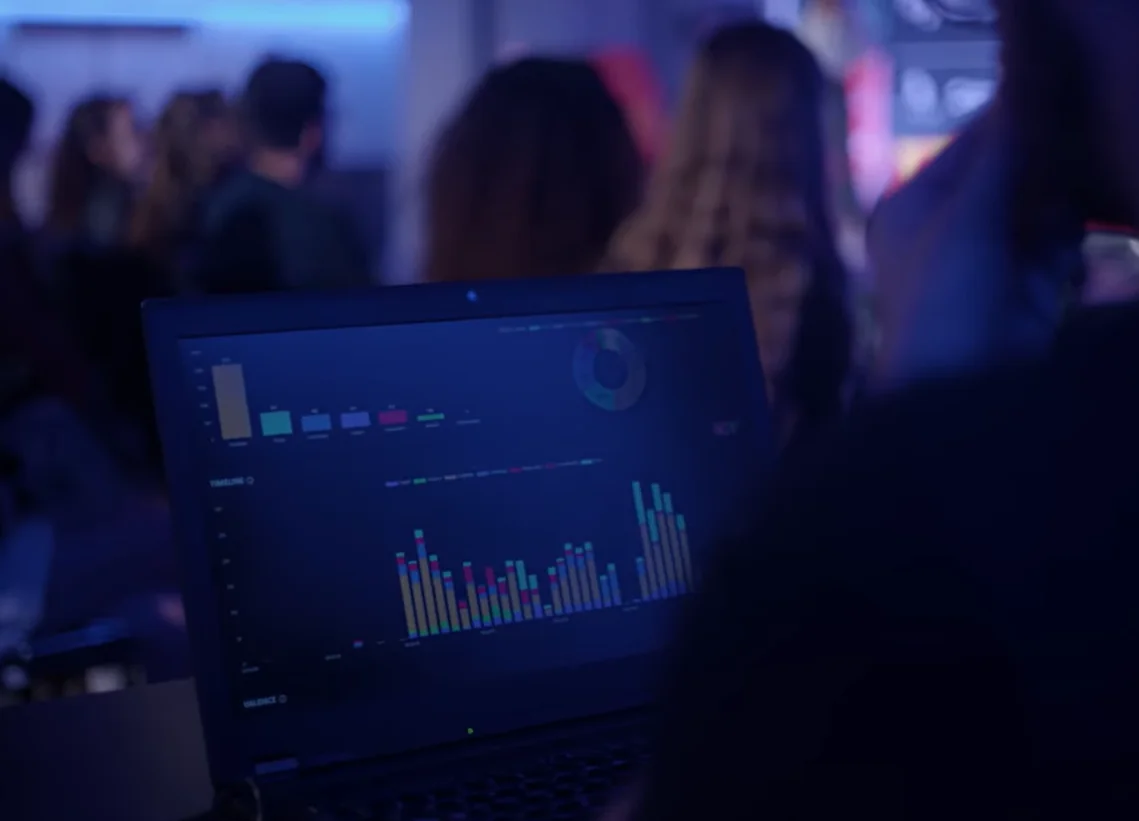
A dashboard shows attention levels and indicators while it happens, so you can react during the session.
A strategic document with the full reading and the decisions worth taking afterwards.
The nine indicators
No indicator is good or bad in itself: it describes the relationship between the content and the audience as a whole, never an individual's state of mind. They are organised into an attentional level (Focus), six experiential ones and two headline readings.
How much attention the audience holds on what is happening. It is the precondition: without focus, everything else measures on a thin base.
How much response energy the content raises: the audience reacts with amplitude to what is going on.
How much weight the content takes on for the audience: what cannot be taken lightly.
How much amplitude the response loses: stretches of calm, rest or a drop in the general level.
How much what is presented fails to fit those receiving it: mismatch and the audience's critical spirit.
Moments of sudden, unexpected response. This is the indicator that pinpoints specific instants on the timeline.
When the stimulus exceeds the audience's capacity: density, simultaneity or duration above the threshold.
How much response there was in total: the equally weighted sum of the six experiential indicators.
Which sign the response carries: whether surface response or deep response prevails.
Live
The dashboard shows attention levels and indicators for the audience as a whole during the session. Whoever runs the event can extend, cut or reorder in the moment.
The report
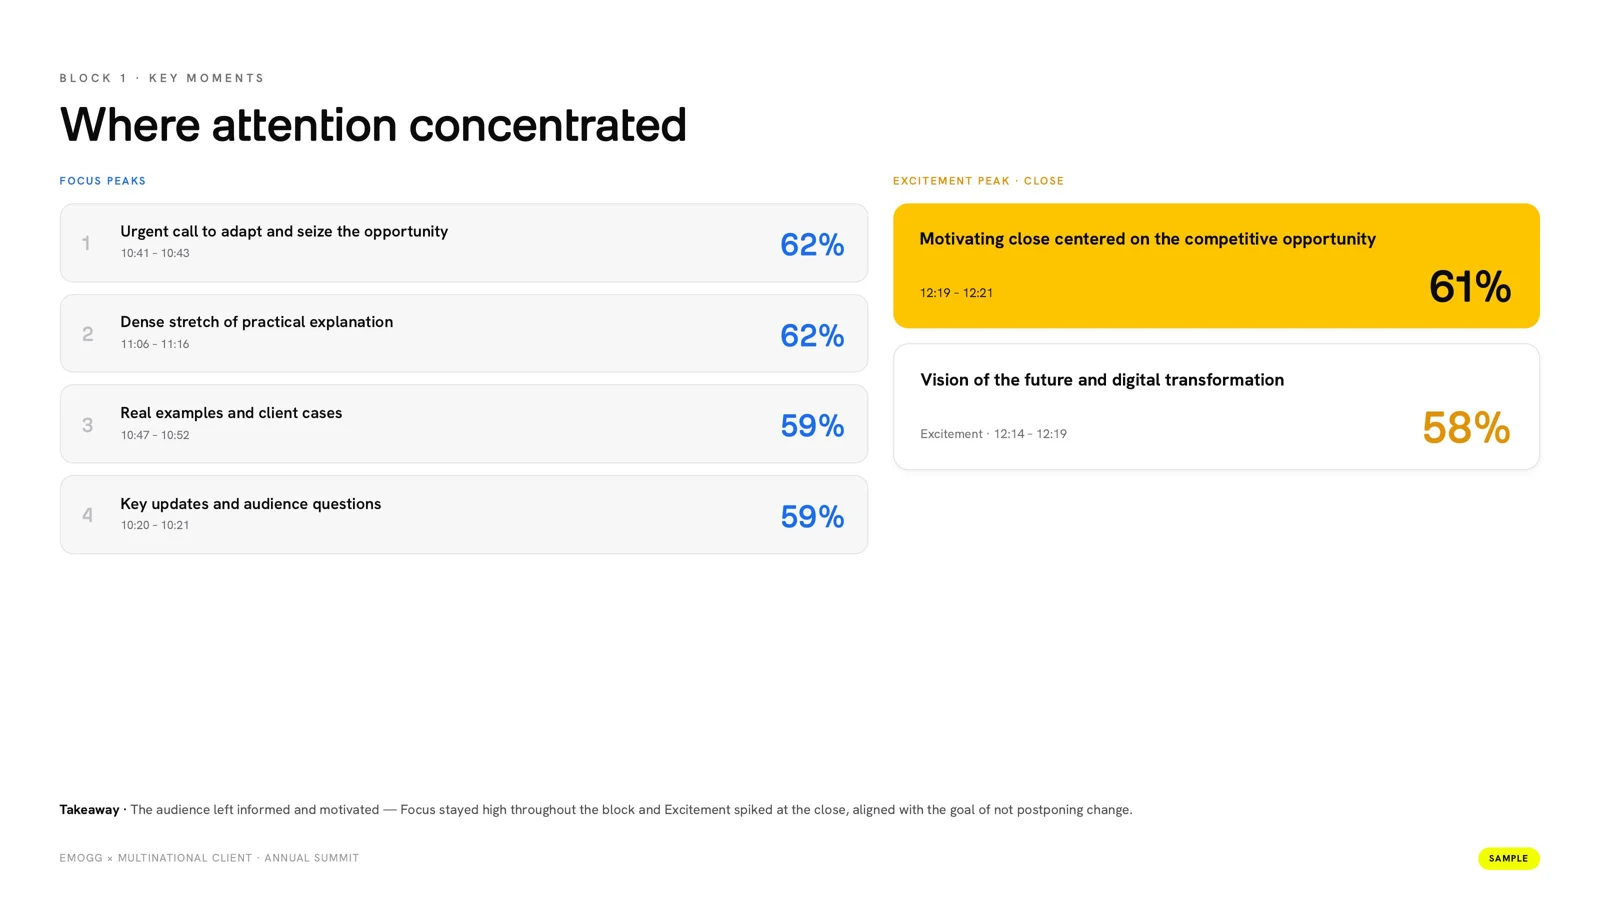
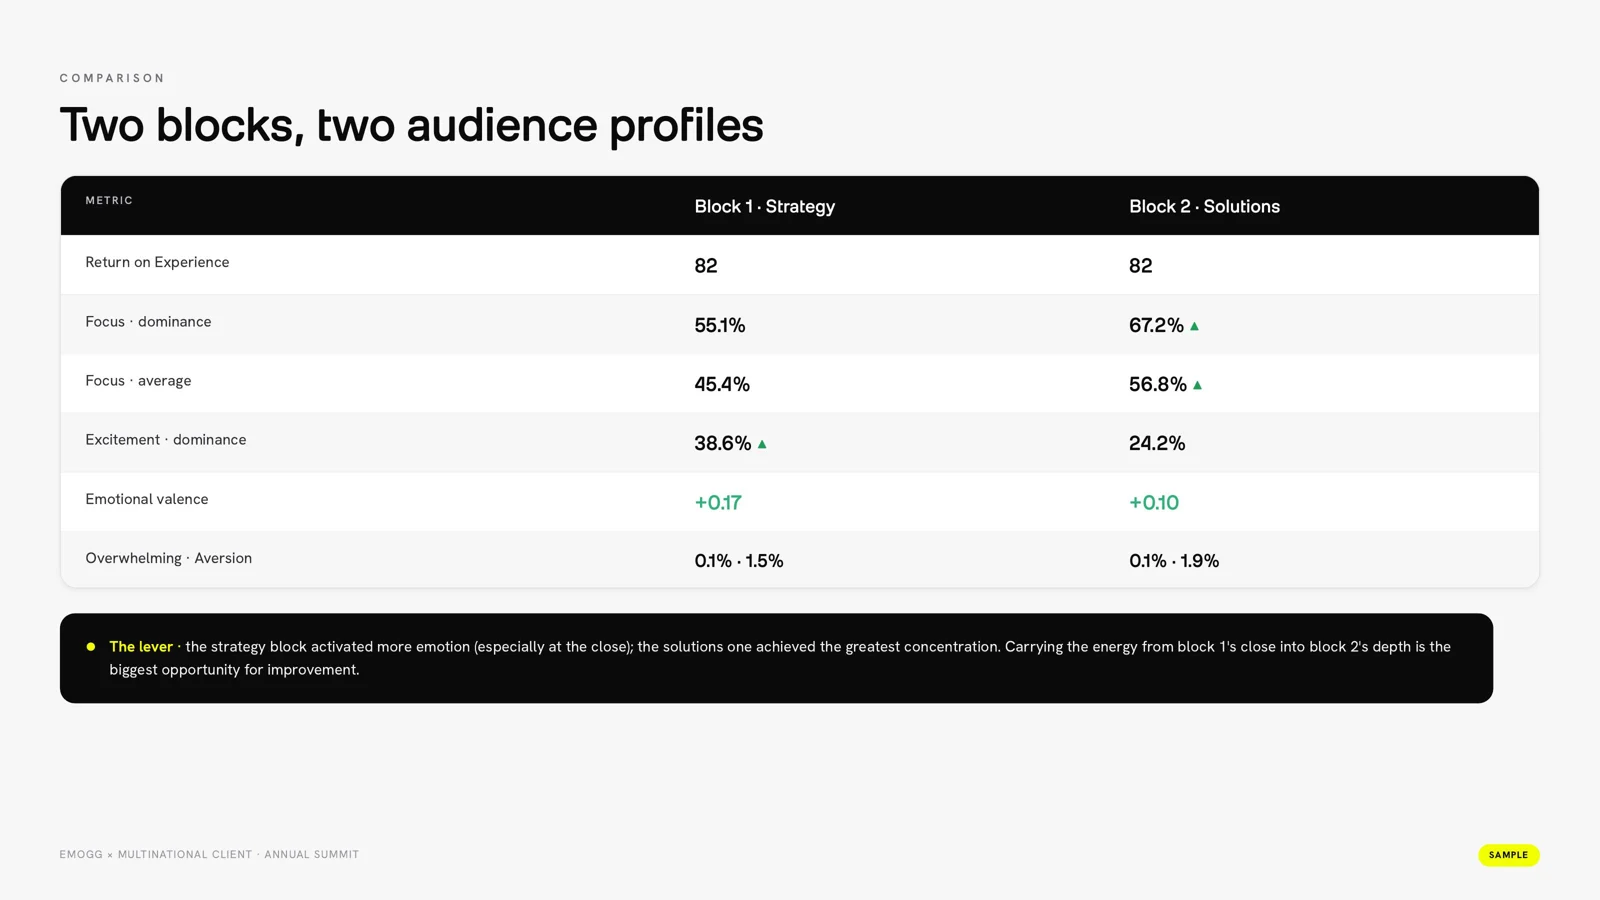
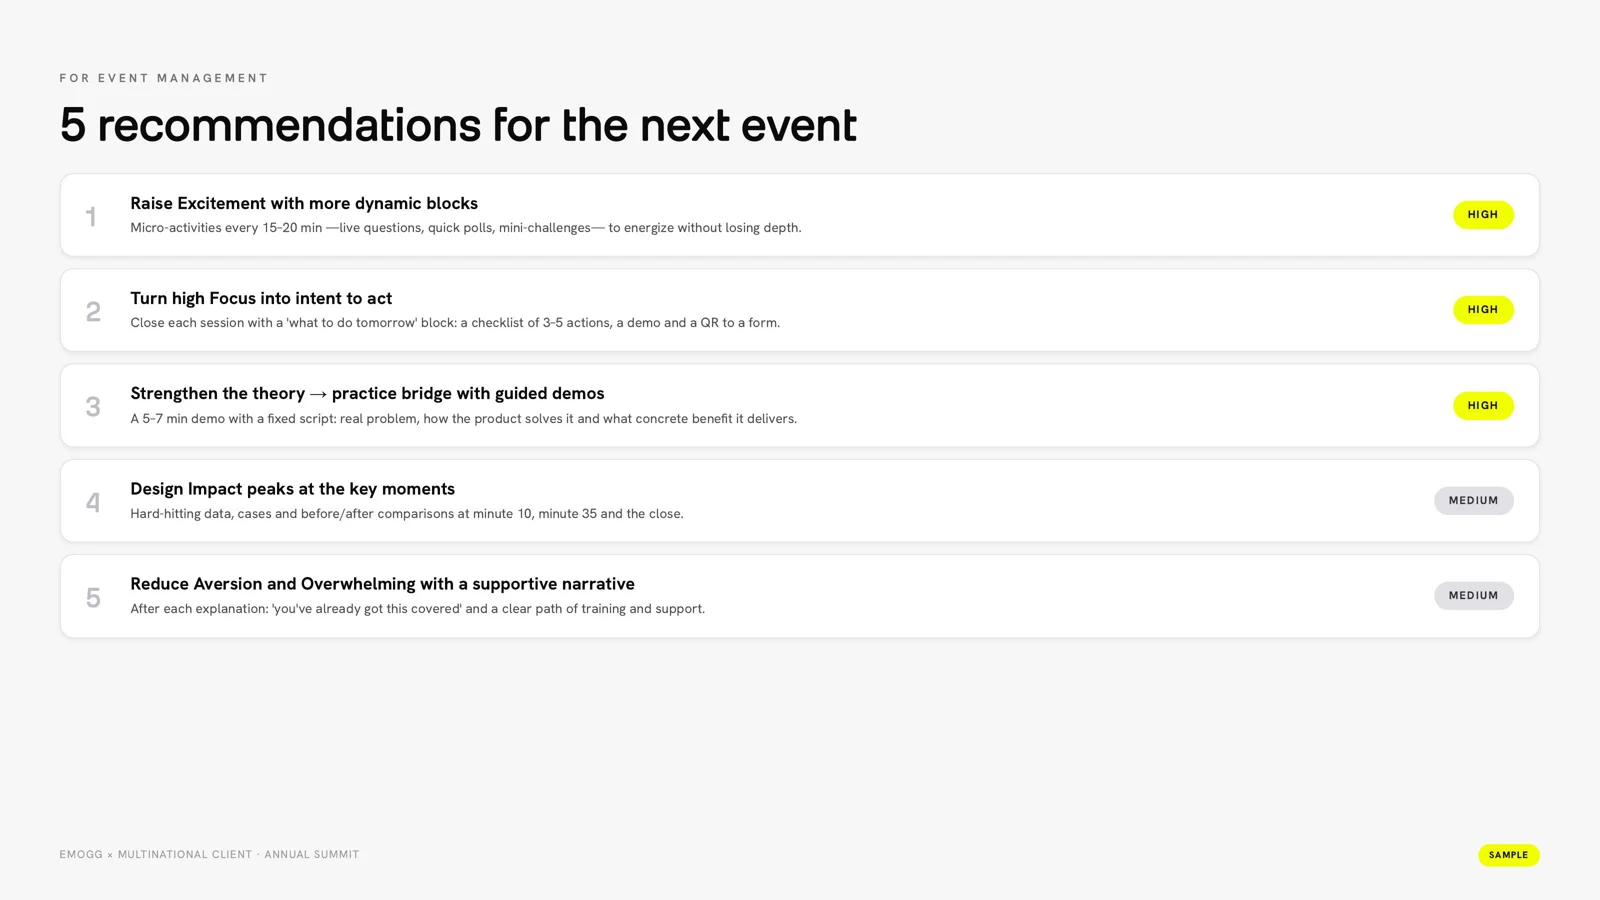
Once it ends, the report can be downloaded from the dashboard: a full reading of the event, block by block, with the key moments and the decisions worth taking next.
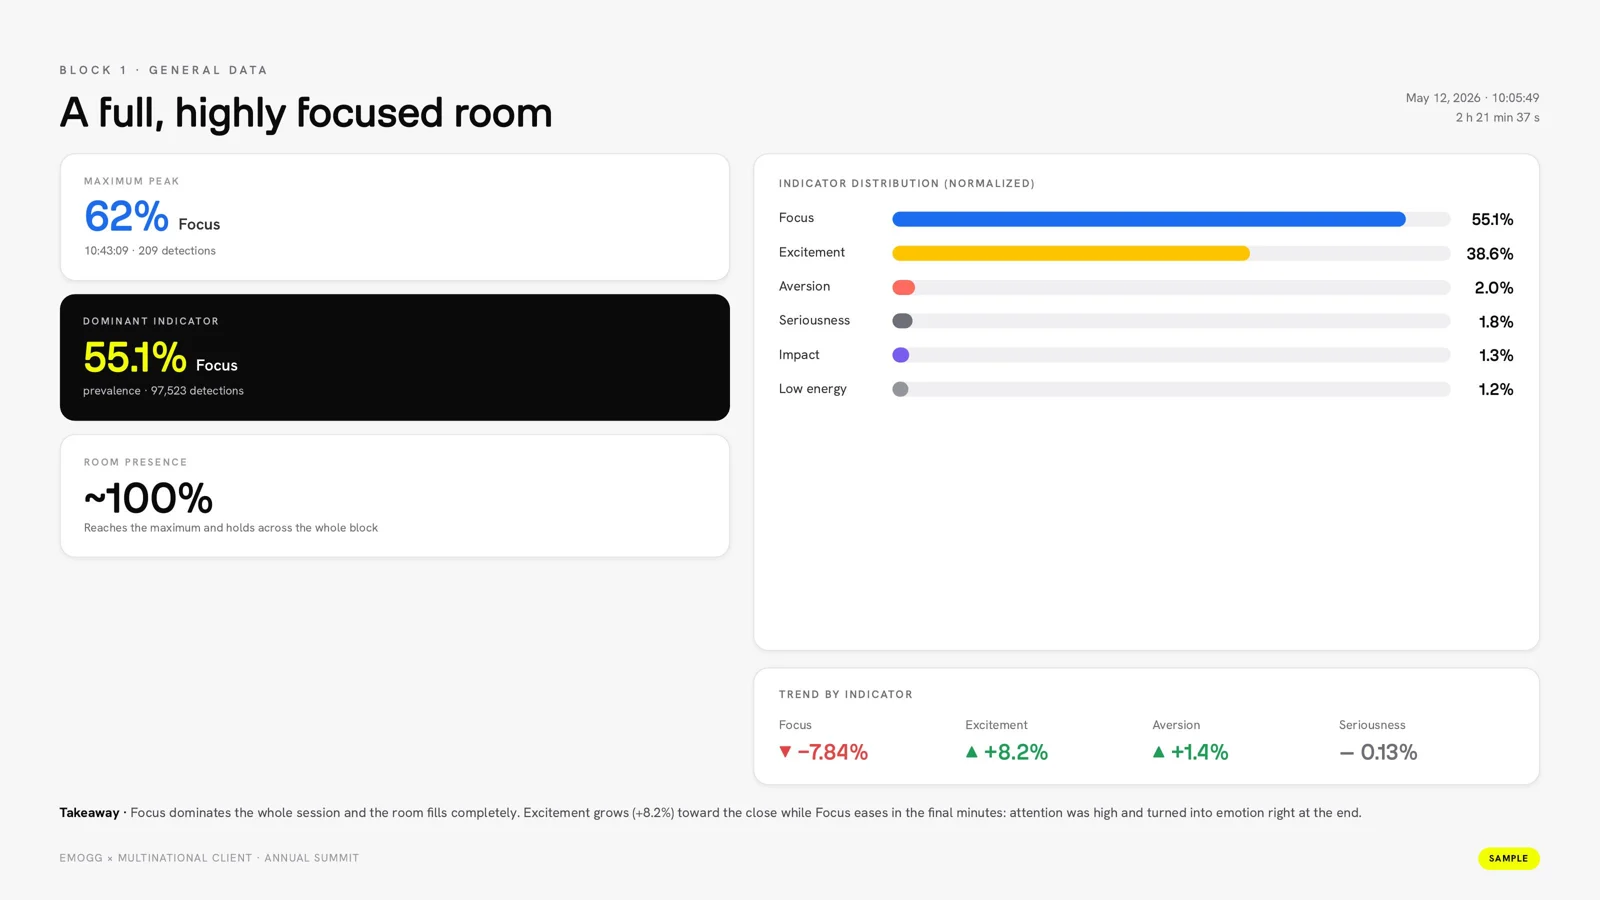
Pages from a real sample report.
Benefits
Objective evidence of which messages and formats work, before investing in the next campaign.
A shared criterion to compare talks, blocks and activations and build the script for the next event.
A demonstration of the return of the experience that goes beyond the final survey.
Privacy
No images or videos are stored
Processing is in streaming; no image or video is stored once the data is obtained.
Aggregated and anonymous data
The reading is taken from the audience as a whole, not from specific individuals.
No personal identification
No data that could identify anyone is extracted or kept: the reading is taken from the audience as a whole.
FAQ
Tell us the content, the space or the experience and we will tell you honestly whether Emogg Analytics can measure it.