MICETrade show stand2026
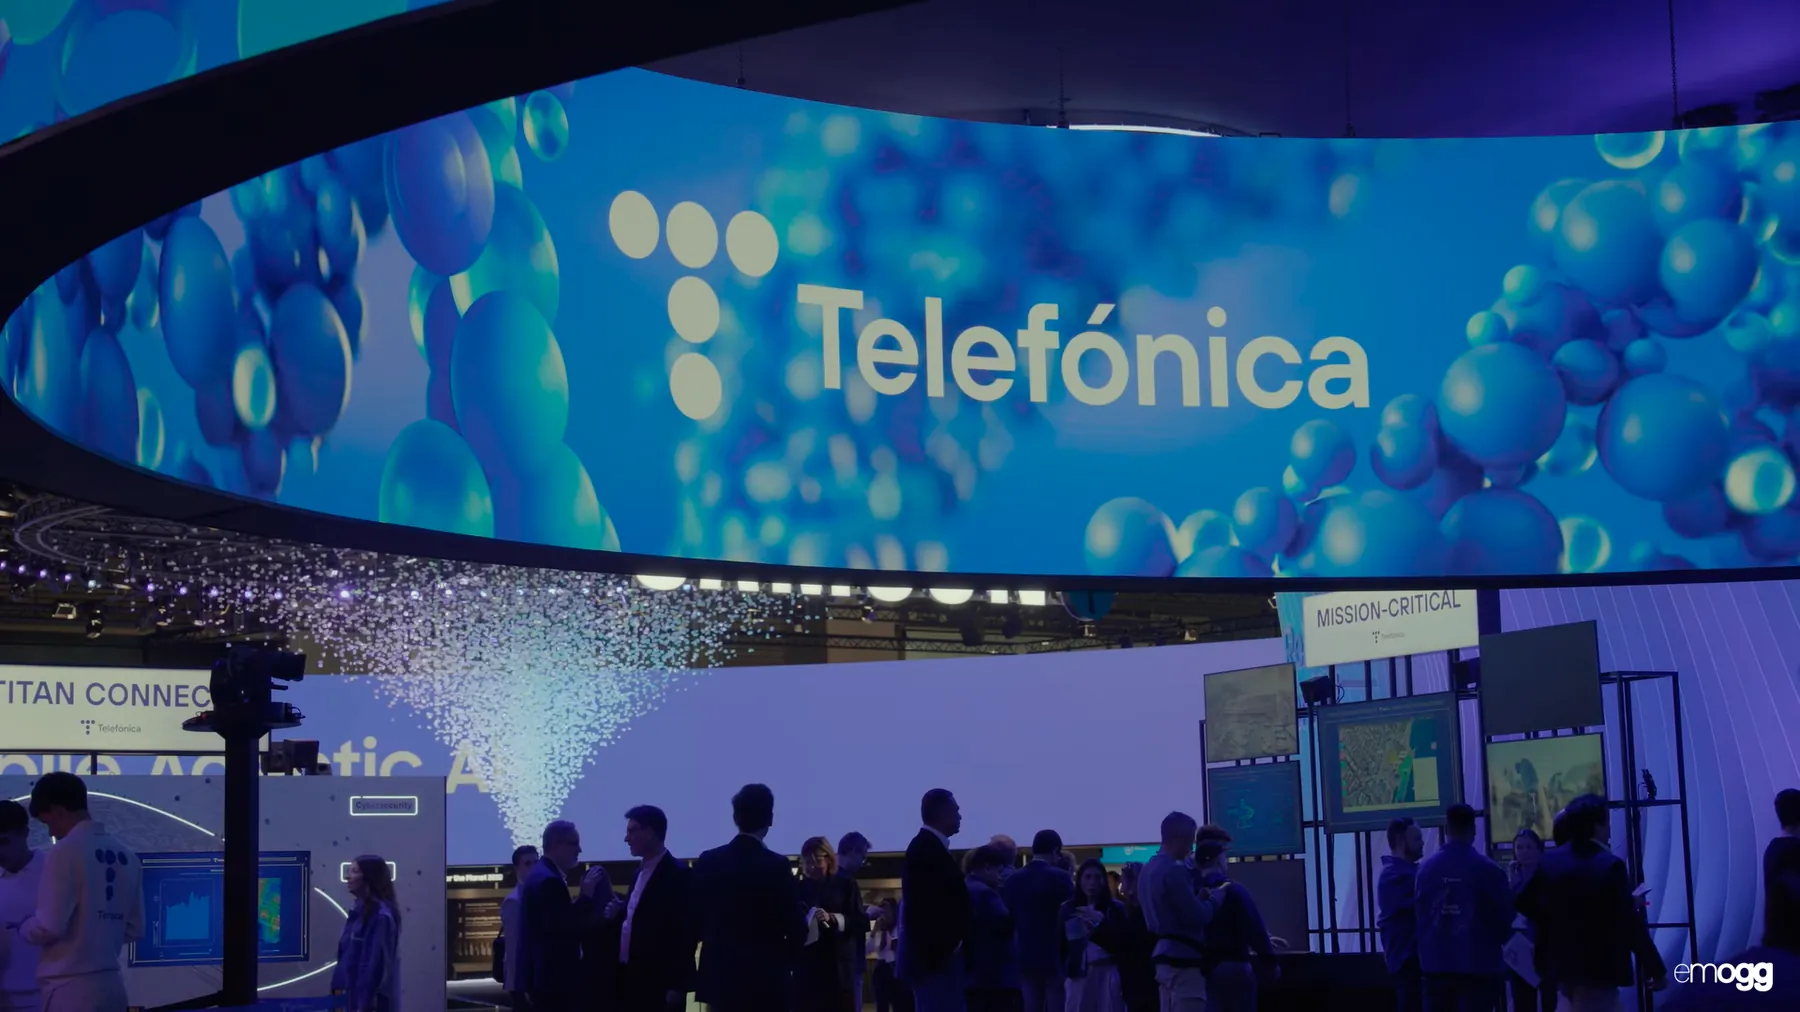
Real-time measurement of Telefónica's stand at MWC 2026
951 m² in Hall 3, three demos and an Ágora with 24 sessions. The question: which one was pulling the crowd while the show was still open.
Evaluating content, spaces and experiences
Emogg Analytics evaluates content, spaces and experiences: it reads the response of a meaningful sample of the audience in real time and turns it into objective data, so decisions improve during the event and the return can be evidenced afterwards.
The problem
Bringing employees, clients and prescribers together to share strategic content takes months of work and a serious share of the budget.
And to know whether it worked, the only instrument available so far was a survey at the end: what people remember living, not what they lived. Marketing, sales, communications and leadership ask for results, and there was nothing to evidence them with.

They have measured with Emogg










Live
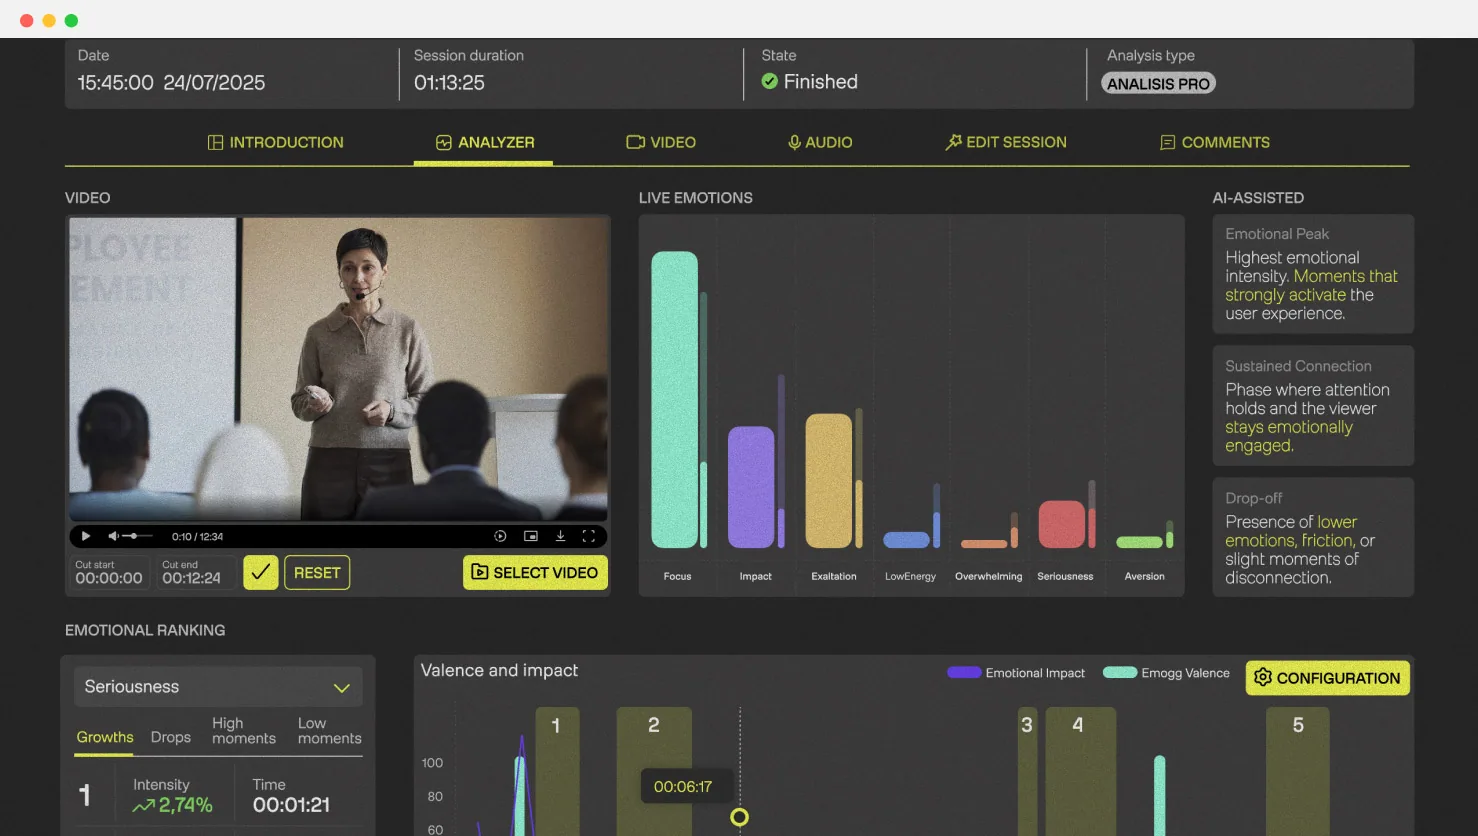
During the session, the dashboard shows attention levels and audience indicators as a whole. Whoever runs the event can react in the moment.

How it works
Fast, non-intrusive setup, GDPR compliant.
Monitor the event in real time through an intuitive interface, free from assumptions.
Attention level and indicators while it happens.
A strategic document with what needs deciding next.
What this enables
See which messages, formats and pieces hold the audience's attention, and which ones to rewrite, shorten or drop before the next campaign.
Compare talks, blocks and activations against the same criteria, and build the next event's run of show on data rather than impressions.
Evaluate how a booth, a room or a route is experienced, and price spaces by the impact they generate, not by the square metres they occupy.
Give leadership, clients or sponsors objective evidence of the return on the experience, beyond the closing survey.
The nine indicators
Each indicator describes what happens between the content and the audience, never an individual's state of mind.
Privacy
No images or videos are stored
Processing is in streaming; no image or video is stored once the data is obtained.
Aggregated and anonymous data
The reading is taken from the audience as a whole, not from specific individuals.
No personal identification
No data that could identify anyone is extracted or kept: the reading is taken from the audience as a whole.
Verticals
Success stories
Cases are published with each client's authorisation.
951 m² in Hall 3, three demos and an Ágora with 24 sessions. The question: which one was pulling the crowd while the show was still open.

Three disciplines, two sites and a mountain venue with no controllable capacity. The question: what is each space and each moment worth when the only thing on record was ticket sales.
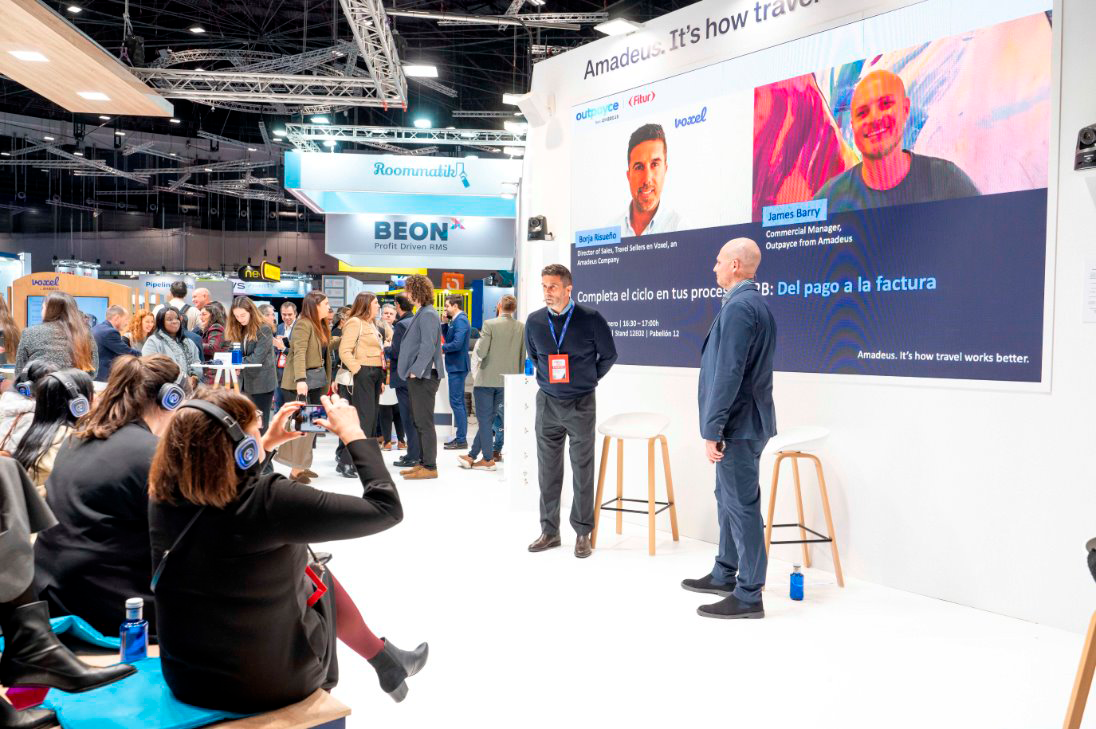
180 m² in Hall 12 at IFEMA and eight Ágora sessions across the three professional days. The question: which messages actually landed with the audience.
Testimonials

“Thanks to Emogg's technology, we turned our presence at the Motortec trade fair at IFEMA into a powerful strategic tool that will help us adjust and improve our new value proposition to the market.”
Miguel Sánchez · Marketing Manager · Volkswagen Group
Tell us what you want to measure and we will tell you honestly whether Emogg can help.