
"Knowing where people are means we can react": measuring the UCI MTB World Cup at Pal Arinsal
Irene Gómez and Francesc Parrilla explain how Setap365 measured crowd numbers, movement and audience reaction during the UCI MTB World Cup at Pal Arinsal — and what they decided while the race was still running.
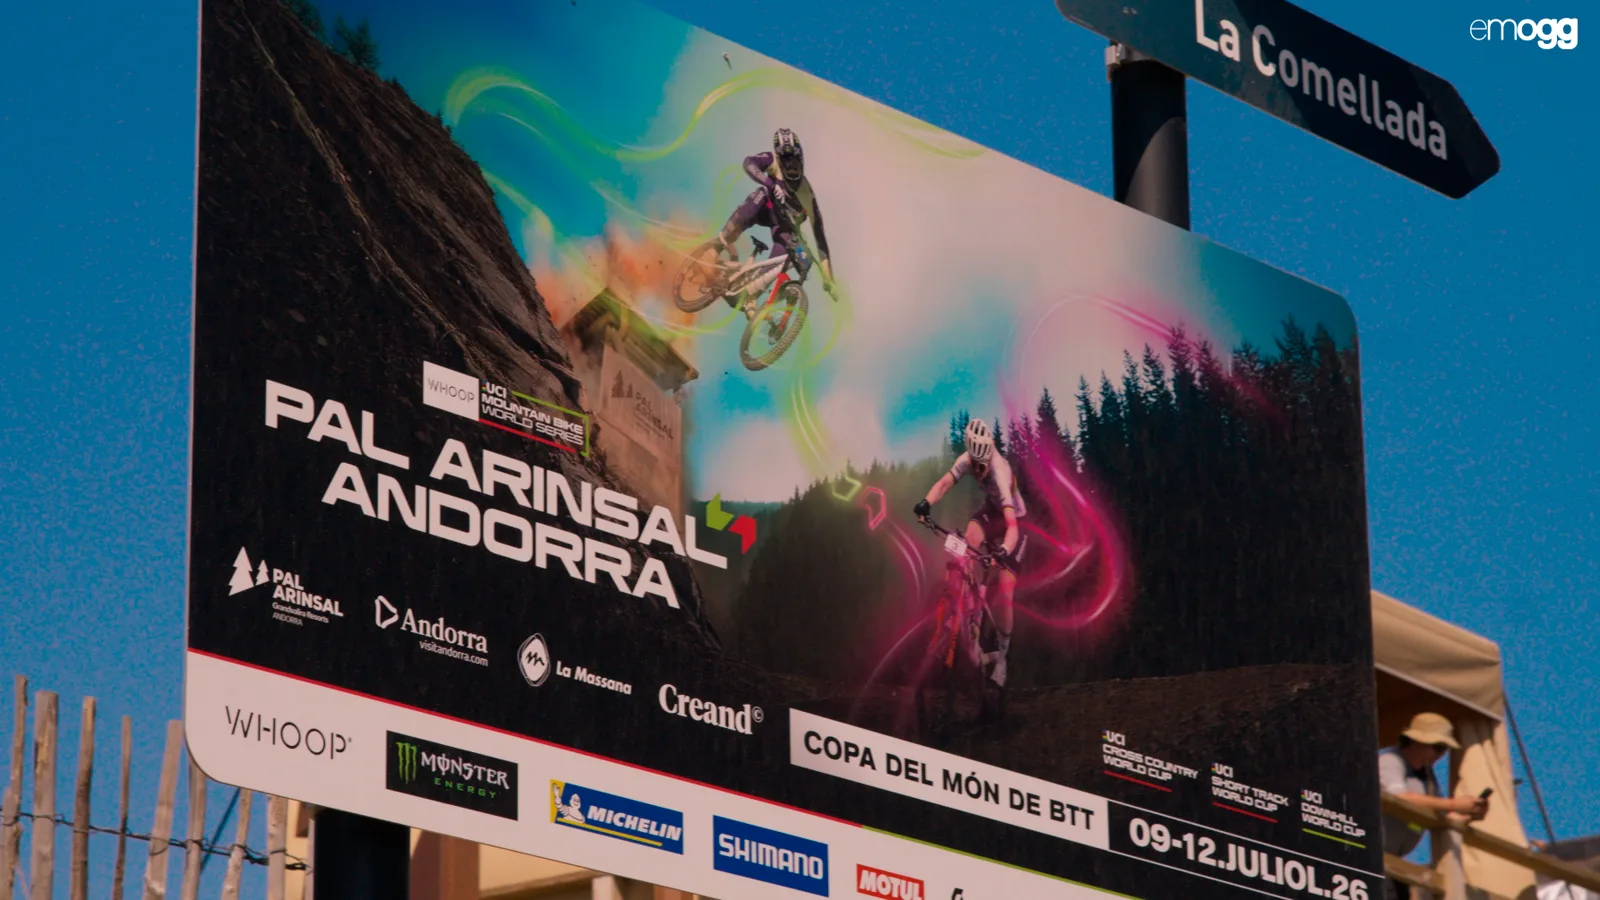
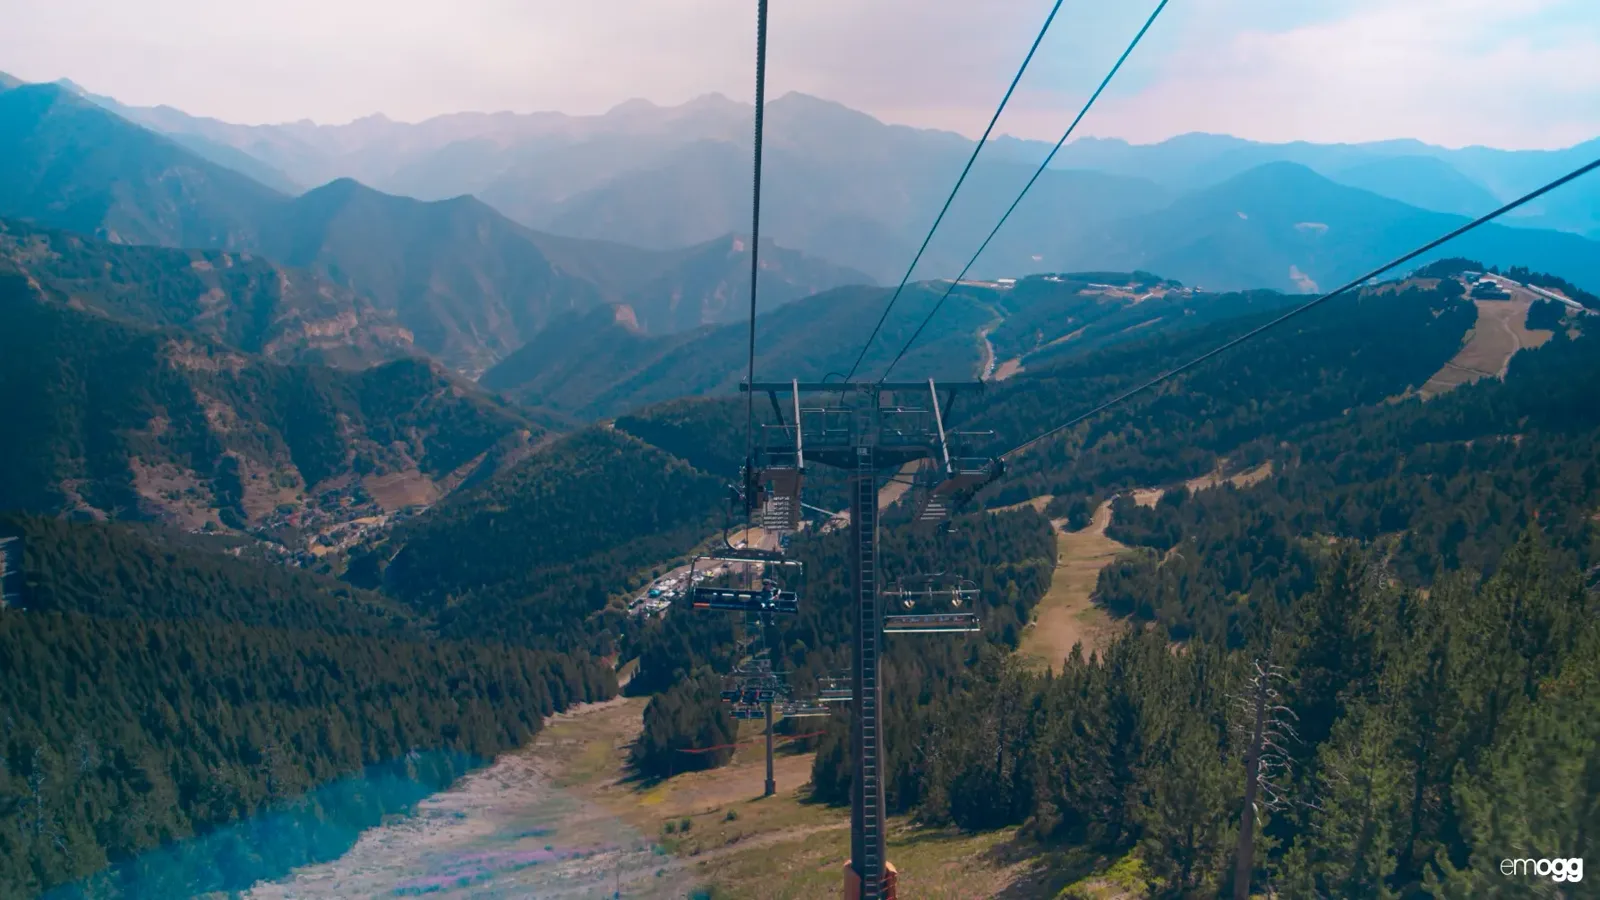
Running a UCI Mountain Bike World Cup round is nothing like filling an arena. At Pal Arinsal the venue is square kilometres of high mountain: short track and Olympic cross country in one sector, the downhill course dropping from Pic del Cubil to Fontanals, lifts connecting zones, spectators moving all day long, and weather that can turn in twenty minutes.
Setap365 has been on the international calendar for years and knows that terrain better than anyone. The question they asked themselves this time was a different one: how do you objectively measure something that has always been managed by instinct and experience?
We spoke with Francesc Parrilla, IT Director, and Irene Gómez, Events & Innovation, about the three fronts on which they deployed Emogg Analytics during the event.
A mountain venue and a visibility problem
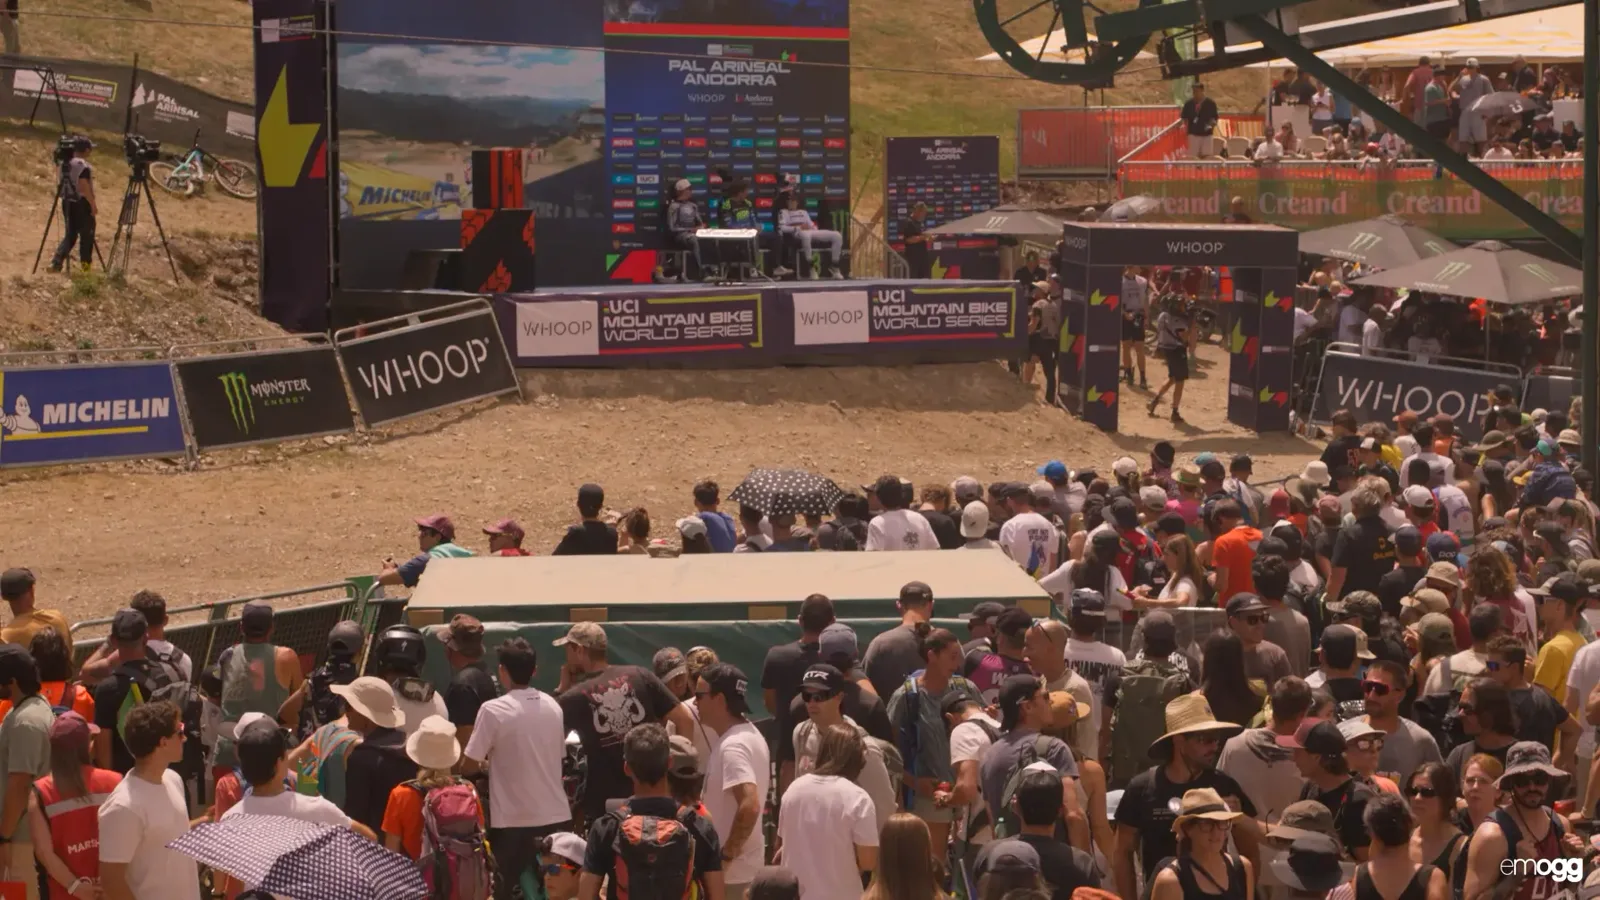
What was your main challenge this year in terms of crowds and operations?
Francesc Parrilla: We've been running this event for many years, and every edition we look for new things that improve the experience and keep us among the leading venues on the calendar. We saw a real opportunity, first of all, to control the flows. Picture it: we're in the mountains, the terrain is rough, we're talking square kilometres. Knowing where people are heading and how they're moving isn't simple. Until now we had the lifts as a reference point, but that isn't enough.
"Yesterday there was an electrical storm. We're in the mountains. Knowing where people are so we can move them matters enormously."
At the main arrival areas, where most of the crowd gathers, we installed sensors to count the flows at each point. That lets us analyse where we need to focus attention, where we should be doing more to draw people in, and where we need to spread them out. But it's also a safety question.
Three layers of measurement on the same infrastructure
What was deployed at Pal Arinsal wasn't a single metric but three complementary products running in parallel on the video feeds the resort already had.
1. Occupancy and dwell time: making the case for the expo area
The first layer measures how many people are in each zone, how long they stay and how they distribute within the space. Heatmaps, dwell times and occupancy curves by time slot.
For an organisation that sells space to brands, that changes the conversation: the expo area stops being sold by square metre and starts being sold by actual audience, with exposure and dwell figures a sponsor can audit.
2. Flows across the venue: safety, routing and zone activations
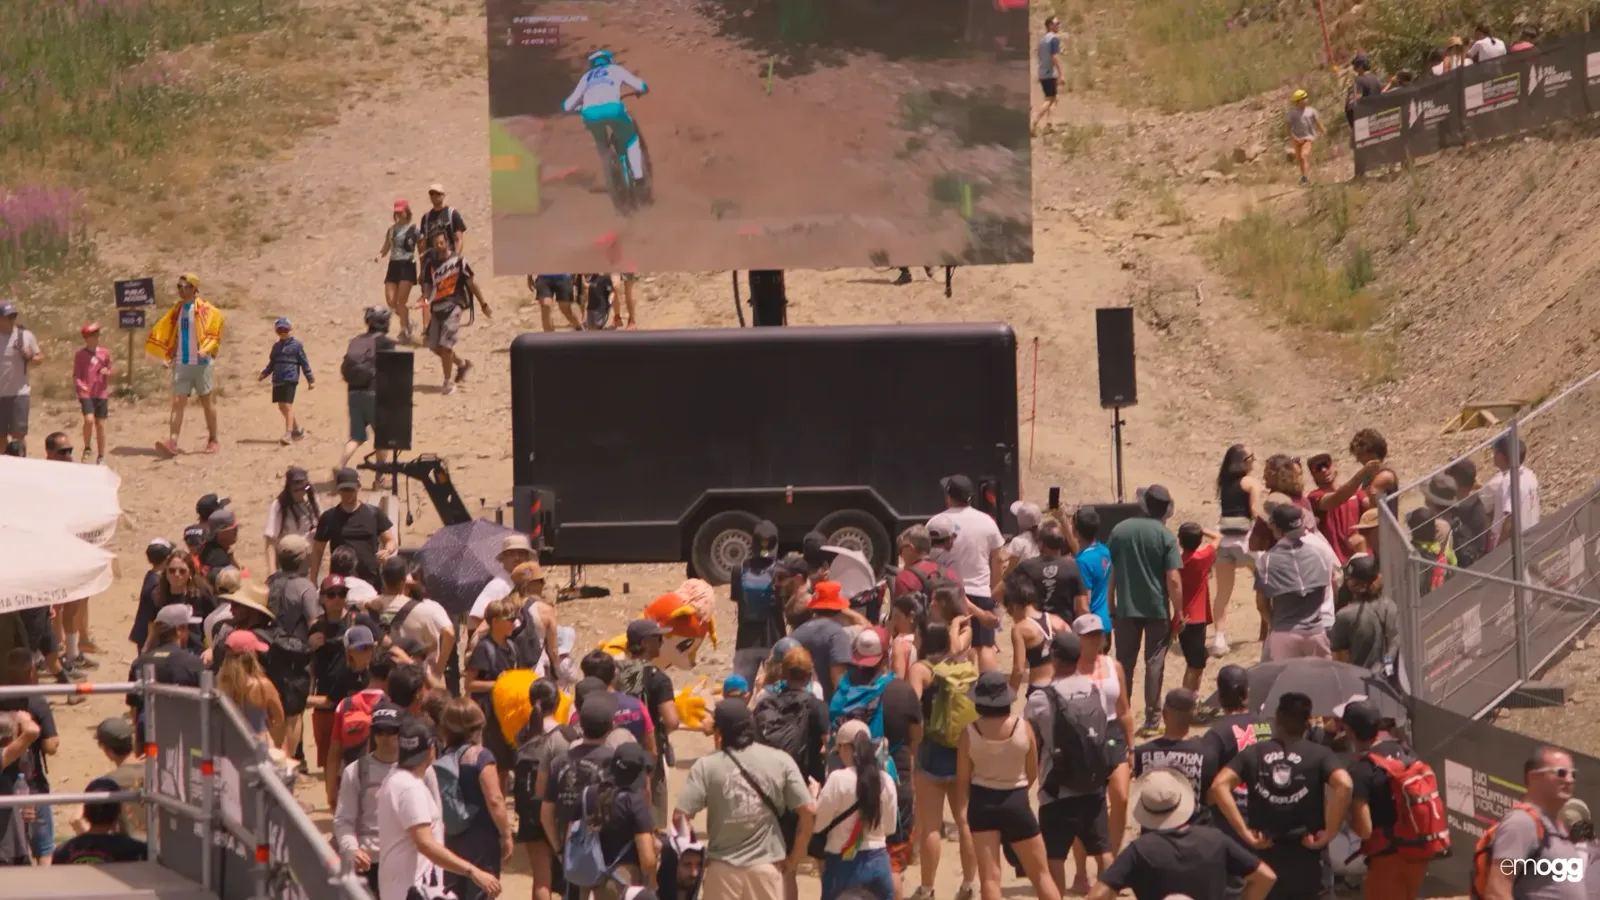
The second layer connects the different areas of the event and answers operational questions: where people come in, how they move between zones, where they bunch up, and how they could be evacuated.
Francesc Parrilla: It helps us size things properly. To ask ourselves: hang on, did we get this right? We can react, send more staff to the food and drink points, open them or hold them back. We might have planned to open at 12, but it turns out there are already 600 people there — so we open now.
3. Content impact: what the crowd actually feels
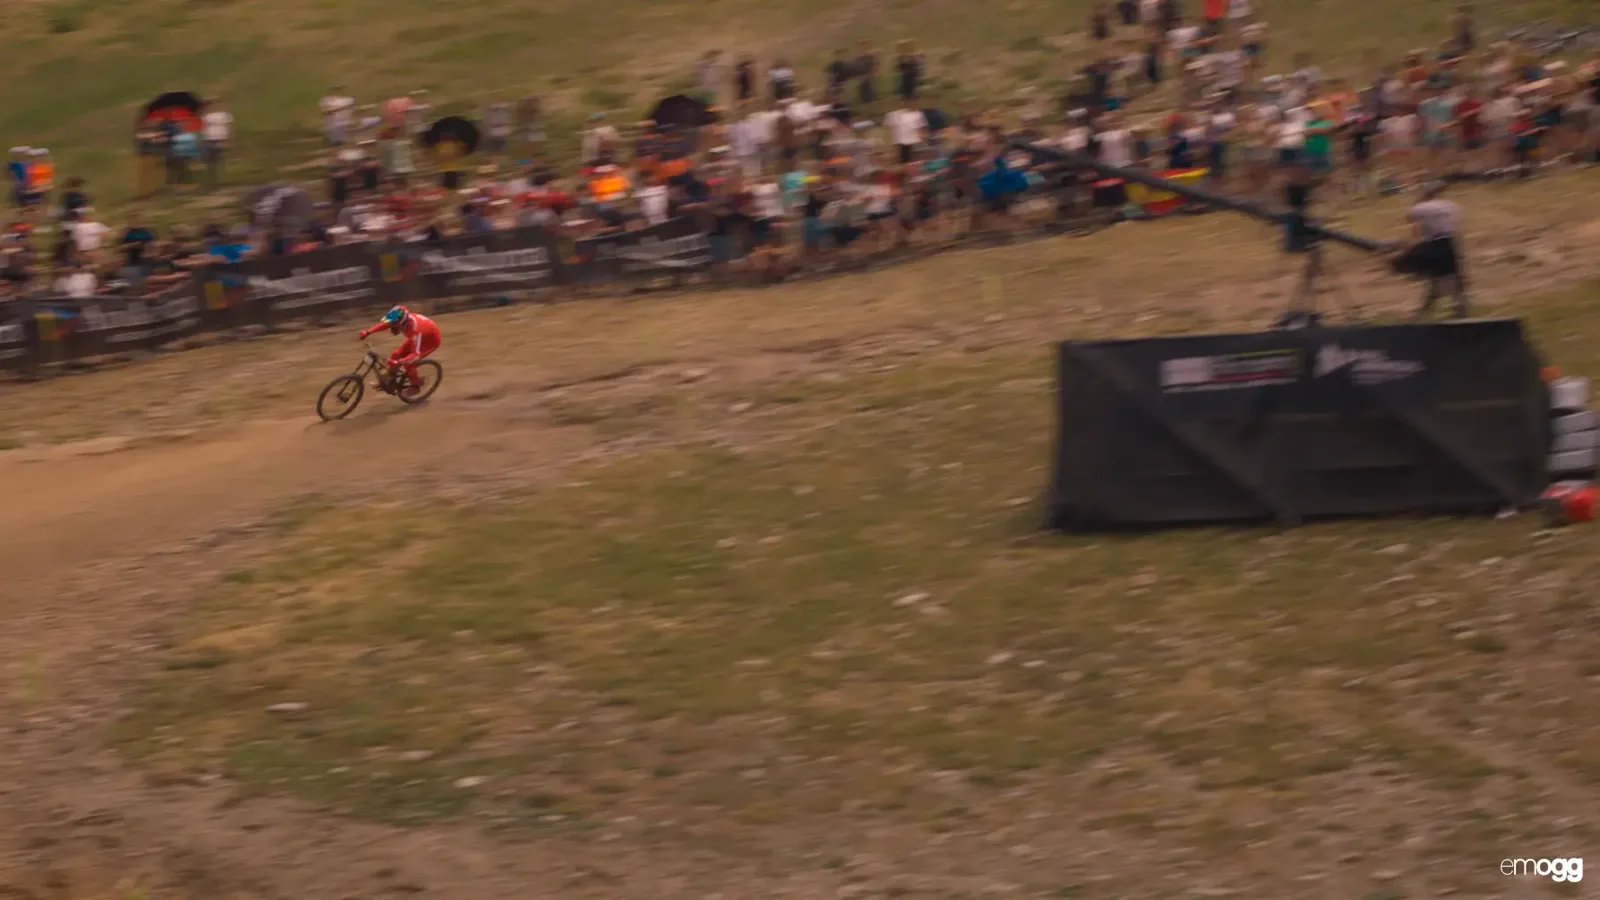
The third layer is the one with the most upside for future editions: measuring how the crowd reacts to what's happening on track, especially in downhill, where the tension and the emotion are compressed into a few seconds per rider.
Francesc Parrilla: At the end of the day this is a sporting event, but it's also a show, and we have to give the spectator everything we can. If we spot moments where people are getting bored, we have to do something, find alternatives. And the other way around: identifying the peak moments, when everyone's on edge, tells us where an activation or a sponsorship placement actually makes sense. Because putting this on is not cheap, I have to say.
"We asked for a camera at the last minute, and the analysis was automatic"
How did the installation go?
Francesc Parrilla: Honestly, fairly easy. We had Irene coordinating alongside my team, but I'd rather she explained it — she lived it up close.
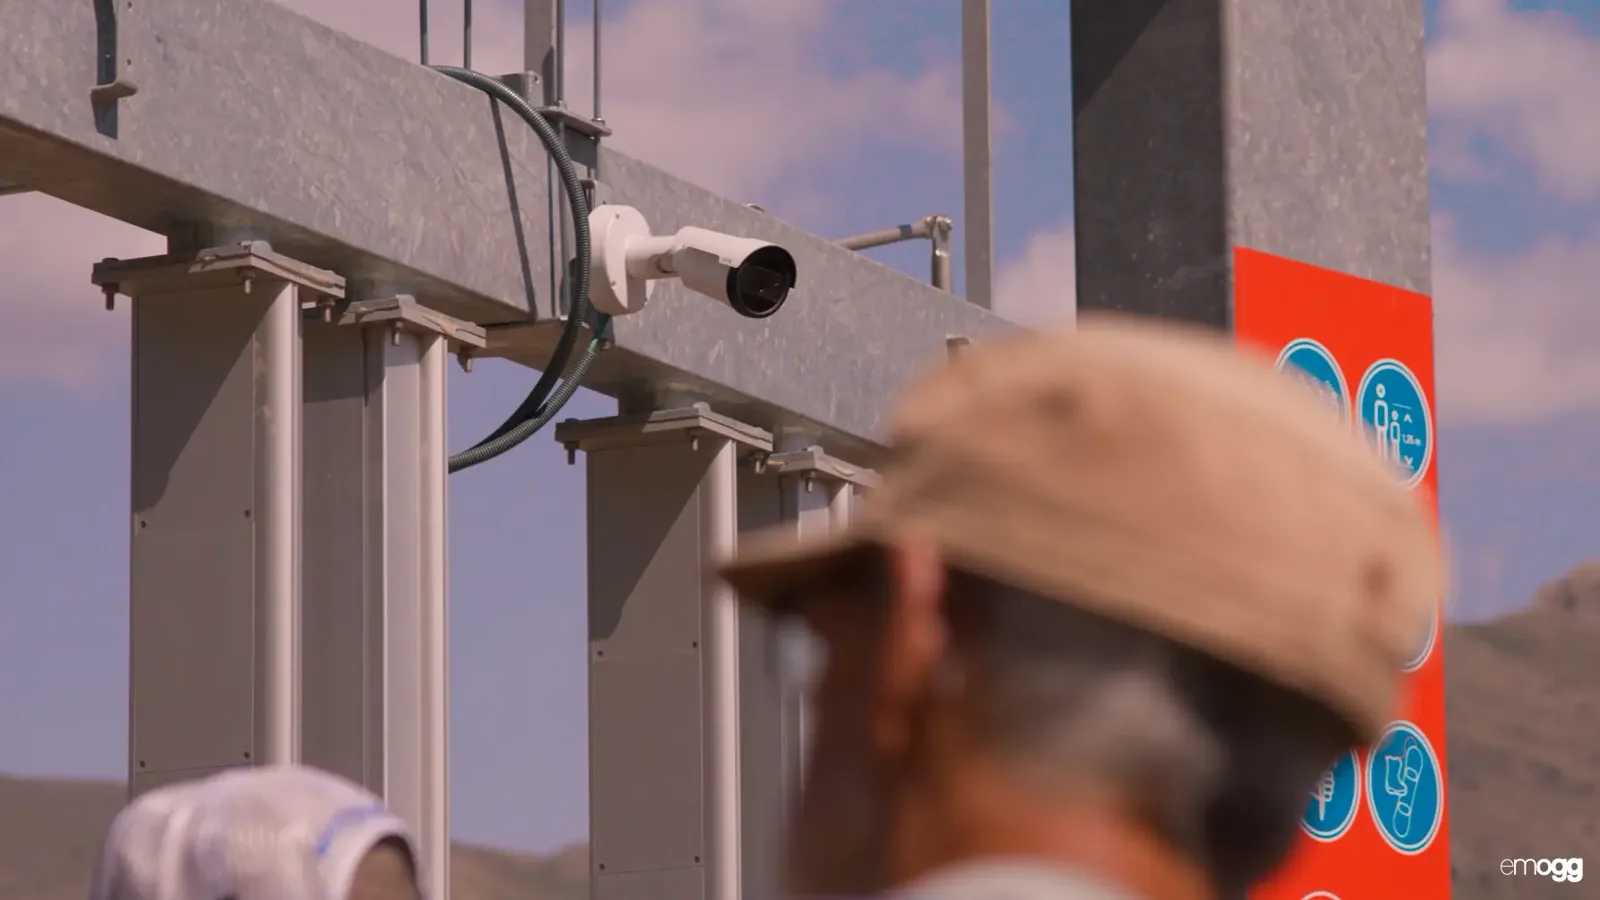
Irene Gómez: The main limitation was on our side, not the solution's. As a company operating in the mountains, it's often hard to position cameras and have an installation ready for last-minute changes. The good thing is that because it's a solution that adapts to any kind of video signal, we had all the flexibility we needed to place sensors wherever we could.
"I remember we even asked to install a new camera at the last minute. The moment the camera is there, the analysis of that image is completely automatic."
That's one of the key points of the deployment: Emogg Analytics requires no proprietary hardware. It works on existing cameras and video feeds, which cuts installation cost and, more importantly, allows for improvisation in environments where infrastructure can't be guaranteed.
Real time to decide, history to improve
What value do you get from the data in real time, and from the analysis afterwards?
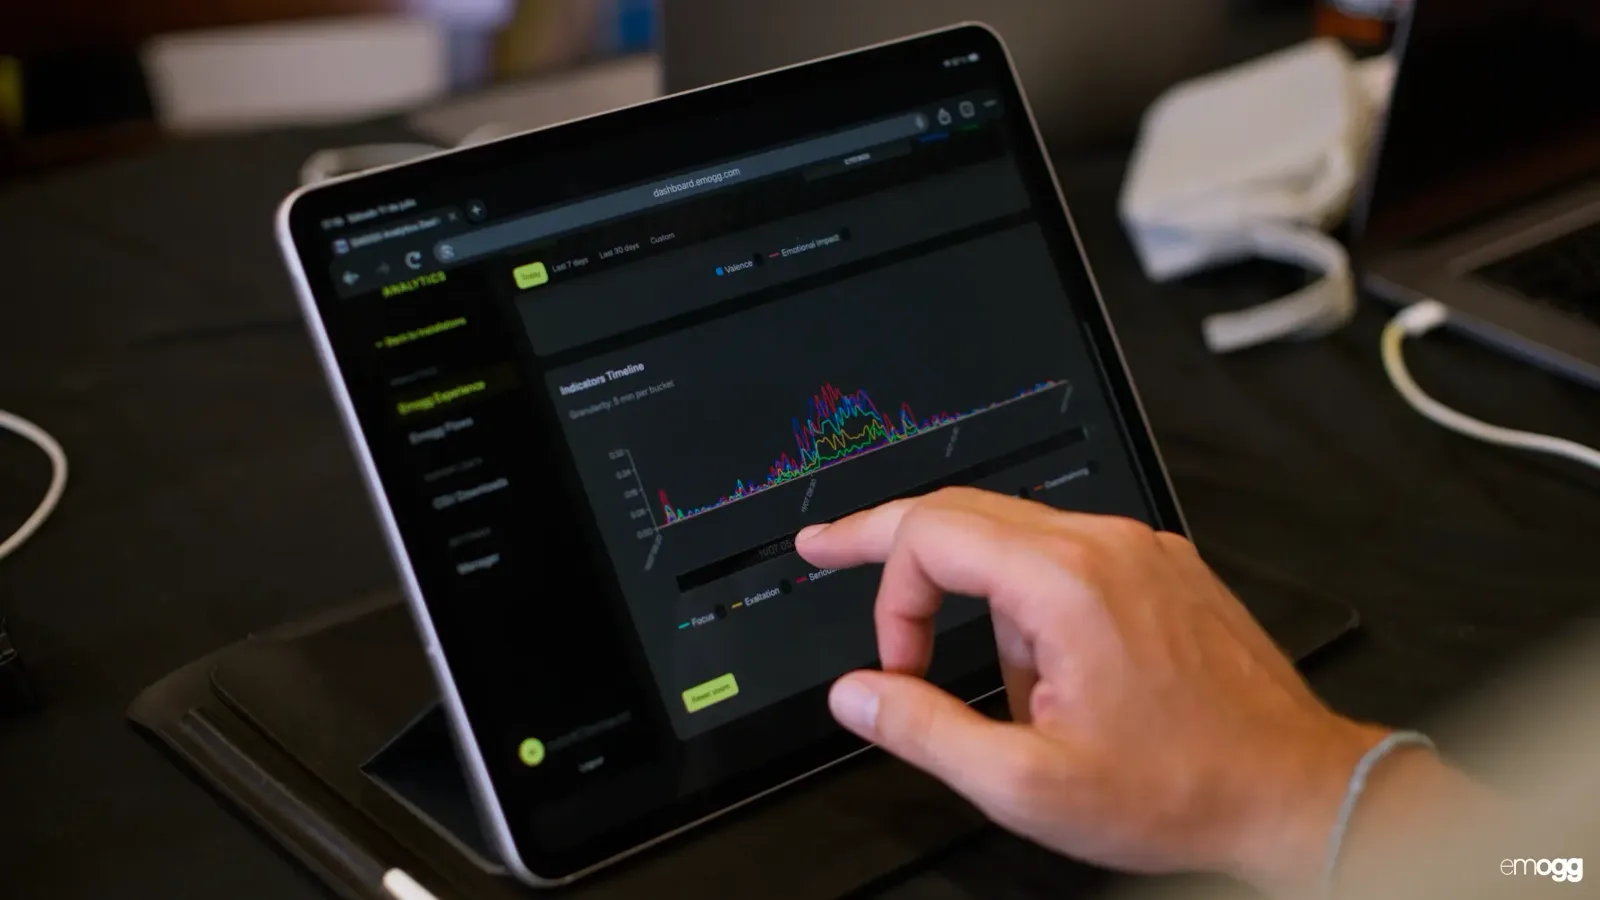
Francesc Parrilla: It's not one value, it's several. In real time, Irene has just given access to every area manager. It gives us huge visibility: we know how many people are arriving, how many are leaving this way, how many are coming from over there. On safety it's obvious. And then, when we analyse all these images and look at the sensations, the peak moments, the calmer or more tense ones, we can act on it for future editions. We're a fixed round on the calendar — we can improve.
"The pain points let us fix things. The good moments let us build visibility outwards: with television, with sponsors, with partners."
Irene Gómez: This is putting technology on top of an experience we've had for many years. Storing all this information and adding an analysis layer on top of an input that is simply an image lets us work on that information afterwards. Because until now, when you're in the middle of organising and working, it's very hard to get an objective view of how people are actually experiencing it, how the crowd is living it through their own eyes. That's the main value Emogg brings us.
Privacy: the precondition, not the small print
What does it mean to you that the solution is GDPR compliant?
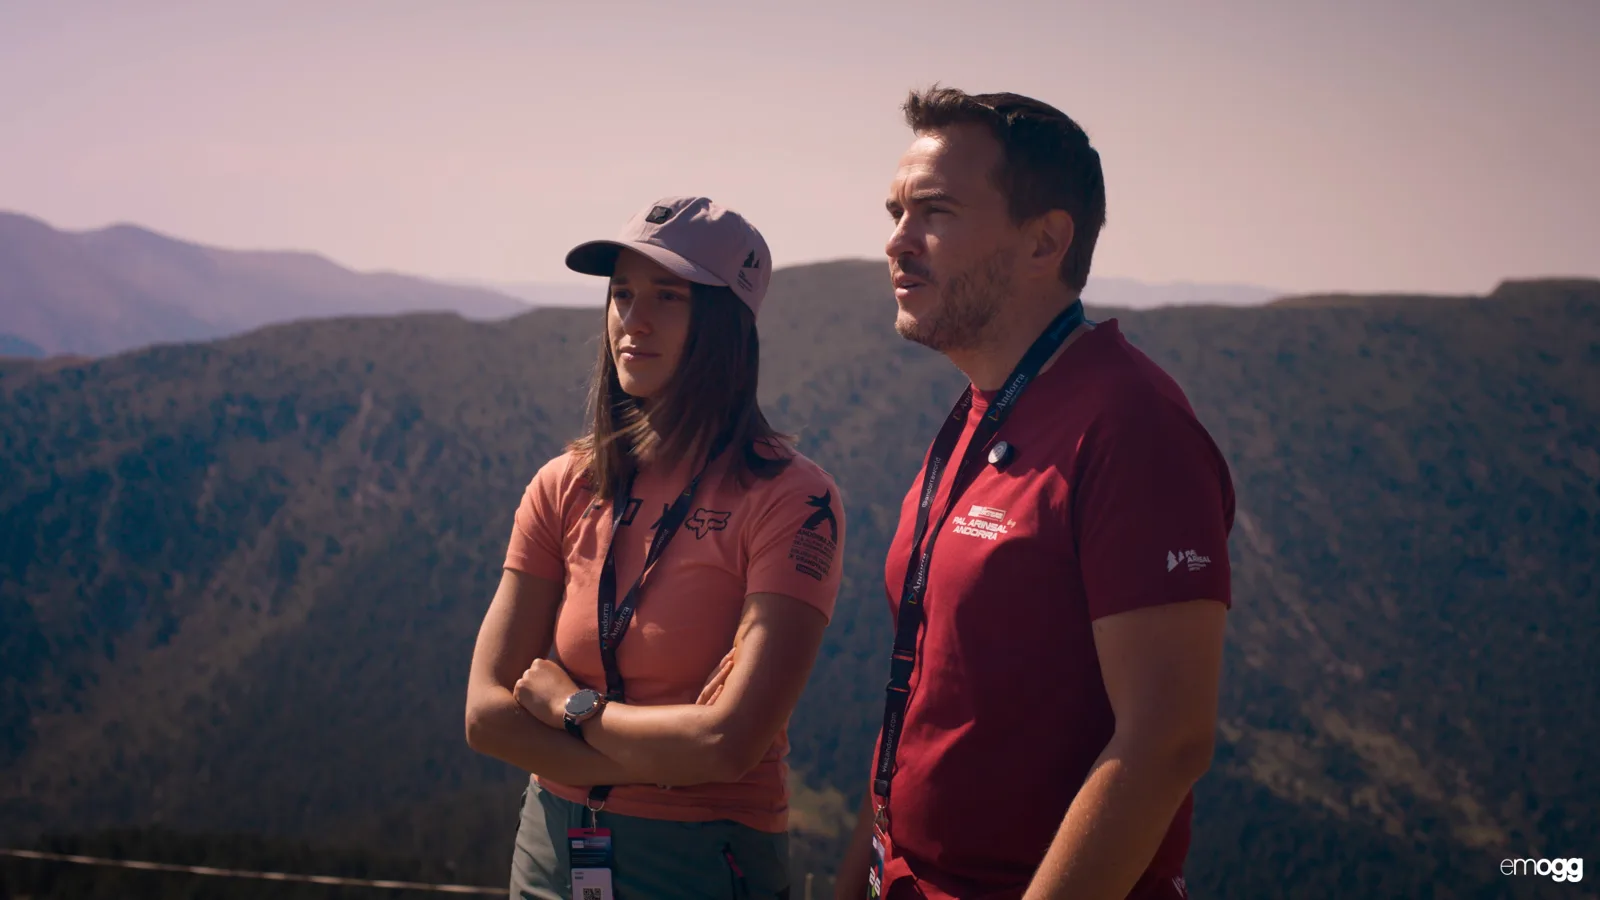
Francesc Parrilla: Above all, it means we can use it or not. If it weren't compliant, however many benefits it offered, we simply couldn't use it. More than that: there are things the law restricts that would be useful to us, but we can't do them, because we have to operate within the law and our customers' privacy comes first. If it weren't compliant, we wouldn't adopt the solution, we wouldn't have this data and we wouldn't have the chance to improve.
Emogg Analytics is built on a privacy-by-design principle: it analyses aggregate behaviour, not identities. There is no facial recognition and no identification of individuals. The output is a metric, not a profile.
What to take from this case
- You don't need new hardware. If you have cameras, you have data.
- Real time changes decisions the same day: opening a food point earlier, reinforcing staff, redistributing crowds, triggering a safety protocol.
- History changes next year's event: where people get bored, where they get excited, which zones deserve more investment.
- Measuring emotional impact turns your content into a commercial argument for sponsors and broadcasters.
Do you run events, manage a venue or design experiences? If Pal Arinsal could measure square kilometres of mountain, your venue is the easy case. Let's talk.